HOT TOPICS LIST
- MACD
- Fibonacci
- RSI
- Gann
- ADXR
- Stochastics
- Volume
- Triangles
- Futures
- Cycles
- Volatility
- ZIGZAG
- MESA
- Retracement
- Aroon
INDICATORS LIST
LIST OF TOPICS
PRINT THIS ARTICLE
by Kevin Hopson
Trendlines can be used to predict reversal points, as well as breakout points.
Position: N/A
Kevin Hopson
Kevin has been a technical analyst for roughly 10 years now. Previously, Kevin owned his own business and acted as a registered investment advisor, specializing in energy. He was also a freelance oil analyst for Orient Trading Co., a commodity futures trading firm in Japan. Kevin is currently a freelance writer.
PRINT THIS ARTICLE
TREND-CHANNEL
Using Trendlines To Predict Price Movement
05/03/05 10:51:38 AMby Kevin Hopson
Trendlines can be used to predict reversal points, as well as breakout points.
Position: N/A
| Sometimes the simplest methods can be the most effective for traders. For example, trendlines are one of the oldest tools used in technical analysis. Unfortunately, some traders believe that sophisticated trading models are the only way to beat the market. As a result, they refuse to utilize straightforward techniques such as trendline analysis. However, this method can be a valuable tool for traders whether you are a novice or a professional, and I can prove it. |
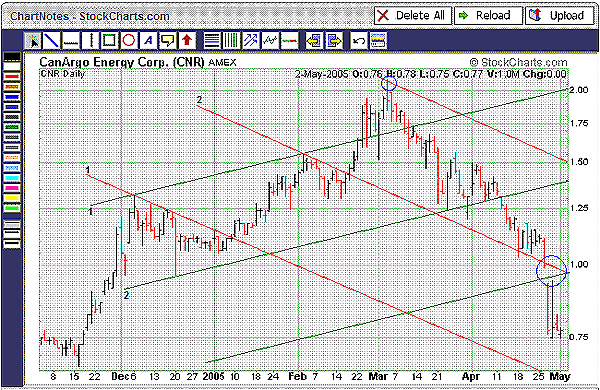
| To illustrate trendline analysis, I am using a chart of CanArgo Energy Corp. (CNR), shown in Figure 1. The first step is to find a series of pivot points (highs/lows) that can be connected to form a trendline. Preferably, you want to find a trendline in the center of the chart. For example, note how I used the middle green trendline (#2) as my starting point. Once you do this, you want to find another trendline that is parallel to the center line. As you can see, the top green trendline (#1) qualified, so I went with this one. |

|
| Figure 1: CanArgo Energy. Using the trendline method can be a valuable tool for traders whether you are a novice or a professional. |
| Graphic provided by: StockCharts.com. |
| |
| When you have two parallel trendlines (or a trading channel), you want to take the distance between the two lines and extend it out. In the case of CanArgo, I drew the new trendline below the center green line. Now you want to find a down trendline and apply the same steps, as illustrated by the red lines. Once you have done this, you can use the new trendlines to determine possible reversal/breakout points. For example, when CanArgo broke above the center red line in mid-February, the top red line was the next area of resistance. As you can see, this trendline acted as a significant reversal point for the stock. As a result, it would have been a good place to sell. |
| Since then, prices have continued to decline. When CanArgo breached the center green line ($1.30) in early April, the next area of support was the $0.95 to $1.00 range. This was the site of the center red line and the lower green line, which had both converged in this price range. Unfortunately, the stock gapped below this support area late last month, giving another sell signal in the process. This means the bottom red line could be the next downside target for CanArgo. |
Kevin has been a technical analyst for roughly 10 years now. Previously, Kevin owned his own business and acted as a registered investment advisor, specializing in energy. He was also a freelance oil analyst for Orient Trading Co., a commodity futures trading firm in Japan. Kevin is currently a freelance writer.
| Glen Allen, VA | |
| E-mail address: | hopson_1@yahoo.com |
Click here for more information about our publications!
Comments
Date: 05/03/05Rank: 4Comment:
Date: 05/04/05Rank: 5Comment:

Request Information From Our Sponsors
- StockCharts.com, Inc.
- Candle Patterns
- Candlestick Charting Explained
- Intermarket Technical Analysis
- John Murphy on Chart Analysis
- John Murphy's Chart Pattern Recognition
- John Murphy's Market Message
- MurphyExplainsMarketAnalysis-Intermarket Analysis
- MurphyExplainsMarketAnalysis-Visual Analysis
- StockCharts.com
- Technical Analysis of the Financial Markets
- The Visual Investor
- VectorVest, Inc.
- Executive Premier Workshop
- One-Day Options Course
- OptionsPro
- Retirement Income Workshop
- Sure-Fire Trading Systems (VectorVest, Inc.)
- Trading as a Business Workshop
- VectorVest 7 EOD
- VectorVest 7 RealTime/IntraDay
- VectorVest AutoTester
- VectorVest Educational Services
- VectorVest OnLine
- VectorVest Options Analyzer
- VectorVest ProGraphics v6.0
- VectorVest ProTrader 7
- VectorVest RealTime Derby Tool
- VectorVest Simulator
- VectorVest Variator
- VectorVest Watchdog
