HOT TOPICS LIST
- MACD
- Fibonacci
- RSI
- Gann
- ADXR
- Stochastics
- Volume
- Triangles
- Futures
- Cycles
- Volatility
- ZIGZAG
- MESA
- Retracement
- Aroon
INDICATORS LIST
LIST OF TOPICS
PRINT THIS ARTICLE
by Kevin Hopson
Pitchfork analysis has been accurate in determining support and resistance levels for the index. Where could prices be headed next?
Position: N/A
Kevin Hopson
Kevin has been a technical analyst for roughly 10 years now. Previously, Kevin owned his own business and acted as a registered investment advisor, specializing in energy. He was also a freelance oil analyst for Orient Trading Co., a commodity futures trading firm in Japan. Kevin is currently a freelance writer.
PRINT THIS ARTICLE
ANDREWS PITCH-FORK
The Importance Of Pitchfork Analysis For The Oil Services Index
05/02/05 07:57:04 AMby Kevin Hopson
Pitchfork analysis has been accurate in determining support and resistance levels for the index. Where could prices be headed next?
Position: N/A
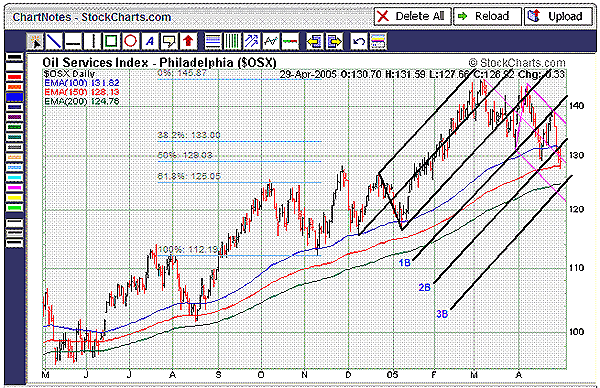
| The Philadelphia Oil Services Index (OSX) has been in a short-term downtrend since early March. During this time, pitchfork analysis has played a significant role in determining support and resistance levels for the index. For example, note how prices had been contained within the black pitchfork since the beginning of the year (Figure 1). When prices breached the bottom parallel line in mid-March, the index proceeded to find support along the 1B channel line. However, the bottom parallel line of the black pitchfork (broken support) quickly turned into resistance during this relief rally. |
| In mid-April, prices broke support along the 1B channel line, which means the 2B channel line was the next trendline to come into play. As you can see, prices bounced off this trendline, but broken support (1B channel line) once again acted as resistance during the rally. In addition, the top parallel line of the purple pitchfork (April's downtrend line) converged here, adding to resistance at this level. Since then, the index has proceeded to move below its 100-day exponential moving average (131.82), as well as the 2B channel line. |

|
| Figure 1: Oil Services Index. Pitchfork analysis has played a significant role in determining support and resistance levels for the index. |
| Graphic provided by: StockCharts.com. |
| |
| As a result, the next area of support appears to be the 125 level. This is the site of the index's 200-day exponential moving average (124.76), the 61.8% retracement level from the November 2004 to March 2005 rally (125.05) and the 3B channel line. Because short interest for OSX component companies rose 2.2% last month and the short interest ratio for the group is still sizable at 3.0x average daily volume, the 125 level could act as a good bouncing point if the index continues to pull back. |
Kevin has been a technical analyst for roughly 10 years now. Previously, Kevin owned his own business and acted as a registered investment advisor, specializing in energy. He was also a freelance oil analyst for Orient Trading Co., a commodity futures trading firm in Japan. Kevin is currently a freelance writer.
| Glen Allen, VA | |
| E-mail address: | hopson_1@yahoo.com |
Click here for more information about our publications!
Comments
Date: 05/02/05Rank: 4Comment:

|

Request Information From Our Sponsors
- StockCharts.com, Inc.
- Candle Patterns
- Candlestick Charting Explained
- Intermarket Technical Analysis
- John Murphy on Chart Analysis
- John Murphy's Chart Pattern Recognition
- John Murphy's Market Message
- MurphyExplainsMarketAnalysis-Intermarket Analysis
- MurphyExplainsMarketAnalysis-Visual Analysis
- StockCharts.com
- Technical Analysis of the Financial Markets
- The Visual Investor
- VectorVest, Inc.
- Executive Premier Workshop
- One-Day Options Course
- OptionsPro
- Retirement Income Workshop
- Sure-Fire Trading Systems (VectorVest, Inc.)
- Trading as a Business Workshop
- VectorVest 7 EOD
- VectorVest 7 RealTime/IntraDay
- VectorVest AutoTester
- VectorVest Educational Services
- VectorVest OnLine
- VectorVest Options Analyzer
- VectorVest ProGraphics v6.0
- VectorVest ProTrader 7
- VectorVest RealTime Derby Tool
- VectorVest Simulator
- VectorVest Variator
- VectorVest Watchdog
