HOT TOPICS LIST
- MACD
- Fibonacci
- RSI
- Gann
- ADXR
- Stochastics
- Volume
- Triangles
- Futures
- Cycles
- Volatility
- ZIGZAG
- MESA
- Retracement
- Aroon
INDICATORS LIST
LIST OF TOPICS
PRINT THIS ARTICLE
by Koos van der Merwe
Canada is in the throes of a political crisis. How is this reflected in the market?
Position: Accumulate
Koos van der Merwe
Has been a technical analyst since 1969, and has worked as a futures and options trader with First Financial Futures in Johannesburg, South Africa.
PRINT THIS ARTICLE
CYCLES
Looking At Canada Through i-Shares' MSCI Canada Index Fund
04/29/05 02:41:02 PMby Koos van der Merwe
Canada is in the throes of a political crisis. How is this reflected in the market?
Position: Accumulate
| The scandal-plagued Liberal government in Canada, led by Prime Minister Paul Martin, is a minority government and a no-confidence vote can occur at any time, causing the government to fall. Further, Martin has antagonized voters by placing his personal political ambitions ahead of the interests of the country, and there is now no doubt that were an election called today, Stephen Harper, leader of the opposing Conservative party, would take over the reins in the Canadian government. Unfortunately, this may not be a solution. The problem is threefold: 1. Stephen Harper is a conservative, and may cancel proposed liberal legislation currently on the table. 2. Harper is also relatively unknown, and although he has stated his party's policies and stressed that they will be beneficial to the country, eastern Canada is still suspicious of the motives of a "Westerner." 3. Another minority government may be voted into power. And because of these uncertainties, the Canadian market has weakened, and will continue to do so. Markets hate change. What do the charts say? |
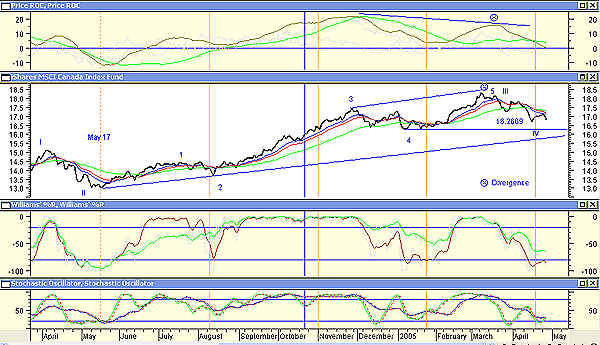
| Figure 1 is a chart of the i-Shares MSCI Canada Index Fund. I have chosen this Barclays index because it can be sold short without having to "borrow" the product. The chart suggests the following (in order shown): |

|
| Figure 1: The i-Shares MSCI Canada Index Fund. The MSCI Canada Index looks as though it will be making a cycle bottom in the near future, probably after an election has been called and completed. |
| Graphic provided by: MetaStock. |
| |
| a. Price ROC. The window shows two lines. The black line is an 81-period exponential moving average (EMA) of a 14-ROC simple moving average (SMA). The green line is a 54-period EMA of a 59-ROC SMA. Both indicators were chosen because they suggest a trend where they cross each other. They are trend-following--a conservative signal, with the advantage that the black line appears to offer a divergent sell signal that proved accurate. Whether it will do so with a buy signal in the future remains to be seen. The move above and below the zero line confirms the trend. b. The second chart is the price chart with three moving averages: a 13-period EMA; a 20-period EMA; and a 50-period EMA. The crossing of the three moving averages by the price or by each other can be a confirmation of the trend. c. The third chart is as follows: The red line is a five-period moving average of a 36-period Williams' %R. The green line is a five-period moving average of a 81-period Williams' %R. This red line appears to be identifying the short-term cycle of the index fund, while the green line seems to be identifying a longer-term cycle. Where the two complement each other, a major bottom appears to be defined. d. The final chart are two stochastic oscillators. The green is an 8,10,3 and the blue is a 10,27,3. Once again, it is when the two complement each other that a major low is confirmed. e. The vertical red lines on the chart are a 58-period cycle starting at the low of May 17. All the indicators on the chart are simply there to confirm the accuracy of this cycle. f. Finally, I have shown an Elliott wave count on the chart, which suggests that the Canada Index is in a fourth wave, with a fifth wave up still to come. |
| What the chart is telling me is that the MSCI Canada Index will be making a cycle bottom in the near future, probably after an election has been called and completed. The index may very well continue to fall to test the support line, or it may bounce off the pivot resistance of 16.26. Either way, it looks as though the correction that the Canadian market is experiencing may soon be at an end. |
Has been a technical analyst since 1969, and has worked as a futures and options trader with First Financial Futures in Johannesburg, South Africa.
| Address: | 3256 West 24th Ave |
| Vancouver, BC | |
| Phone # for sales: | 6042634214 |
| E-mail address: | petroosp@gmail.com |
Click here for more information about our publications!
Comments
Date: 04/29/05Rank: 3Comment:

Request Information From Our Sponsors
- StockCharts.com, Inc.
- Candle Patterns
- Candlestick Charting Explained
- Intermarket Technical Analysis
- John Murphy on Chart Analysis
- John Murphy's Chart Pattern Recognition
- John Murphy's Market Message
- MurphyExplainsMarketAnalysis-Intermarket Analysis
- MurphyExplainsMarketAnalysis-Visual Analysis
- StockCharts.com
- Technical Analysis of the Financial Markets
- The Visual Investor
- VectorVest, Inc.
- Executive Premier Workshop
- One-Day Options Course
- OptionsPro
- Retirement Income Workshop
- Sure-Fire Trading Systems (VectorVest, Inc.)
- Trading as a Business Workshop
- VectorVest 7 EOD
- VectorVest 7 RealTime/IntraDay
- VectorVest AutoTester
- VectorVest Educational Services
- VectorVest OnLine
- VectorVest Options Analyzer
- VectorVest ProGraphics v6.0
- VectorVest ProTrader 7
- VectorVest RealTime Derby Tool
- VectorVest Simulator
- VectorVest Variator
- VectorVest Watchdog
