HOT TOPICS LIST
- MACD
- Fibonacci
- RSI
- Gann
- ADXR
- Stochastics
- Volume
- Triangles
- Futures
- Cycles
- Volatility
- ZIGZAG
- MESA
- Retracement
- Aroon
INDICATORS LIST
LIST OF TOPICS
PRINT THIS ARTICLE
by Jayanthi Gopalakrishnan
Ever experienced a sharp decline in prices? Given the volatility of the markets, it is not unusual for this to happen.
Position: N/A
Jayanthi Gopalakrishnan
PRINT THIS ARTICLE
Dead Cat Bounce
06/27/00 10:30:00 AMby Jayanthi Gopalakrishnan
Ever experienced a sharp decline in prices? Given the volatility of the markets, it is not unusual for this to happen.
Position: N/A
| When the price of a security declines sharply look for the formation of a dead cat bounce. Usually such declines are followed by a short-lived recovery period. Prices bounce up, reach a recovery high, and continue sliding down even further. |
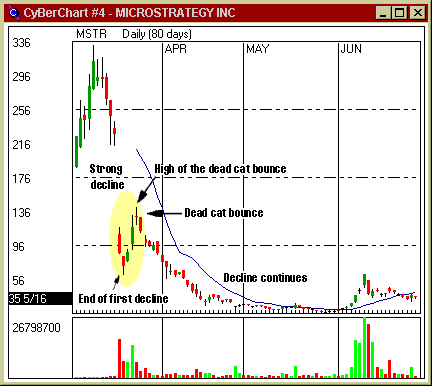
| An example can be seen in the chart of Microstrategy, Inc. (MSTR). The strong decline on 3/20/00 from 226.75 to 86.75 was followed by a recovery with prices going as high as 142 on 3/27/00. This recovery took place within three days after which prices continued dropping even further. |

|
| Here you see the formation of a dead cat bounce after a sharp decline in prices. |
| Graphic provided by: CyBerCorp, Inc.. |
| |
| If you had an open position in MSTR when it declined on 3/20/00, you obviously would have lost a substantial portion of your investment. These sharp declines can take you by surprise and unless you suspected this type of action, there isn't much you can do. If you have an open position in a stock that declines sharply consider it a sign to exit the position. |
| You can use dead cat bounces to identify shorting opportunities. After their occurence you can enter a short position at the high of the bounce and profit from this position by exiting your position at the low of the decline that is expected to follow. |
| Title: | Editor |
| Company: | Technical Analysis of Stocks & Commodities |
| Address: | 4757 California Ave SW |
| Seattle, WA 98116 | |
| Website: | Traders.com |
| E-mail address: | Jayanthi@traders.com |
Traders' Resource Links | |
| Charting the Stock Market: The Wyckoff Method -- Books | |
| Working-Money.com -- Online Trading Services | |
| Traders.com Advantage -- Online Trading Services | |
| Technical Analysis of Stocks & Commodities -- Publications and Newsletters | |
| Working Money, at Working-Money.com -- Publications and Newsletters | |
| Traders.com Advantage -- Publications and Newsletters | |
| Professional Traders Starter Kit -- Software | |
Click here for more information about our publications!
Comments
Date: / /Rank: 1Comment: why did i never think of selling at the high of a bounce and buying at the low of the following decline?

Request Information From Our Sponsors
- StockCharts.com, Inc.
- Candle Patterns
- Candlestick Charting Explained
- Intermarket Technical Analysis
- John Murphy on Chart Analysis
- John Murphy's Chart Pattern Recognition
- John Murphy's Market Message
- MurphyExplainsMarketAnalysis-Intermarket Analysis
- MurphyExplainsMarketAnalysis-Visual Analysis
- StockCharts.com
- Technical Analysis of the Financial Markets
- The Visual Investor
- VectorVest, Inc.
- Executive Premier Workshop
- One-Day Options Course
- OptionsPro
- Retirement Income Workshop
- Sure-Fire Trading Systems (VectorVest, Inc.)
- Trading as a Business Workshop
- VectorVest 7 EOD
- VectorVest 7 RealTime/IntraDay
- VectorVest AutoTester
- VectorVest Educational Services
- VectorVest OnLine
- VectorVest Options Analyzer
- VectorVest ProGraphics v6.0
- VectorVest ProTrader 7
- VectorVest RealTime Derby Tool
- VectorVest Simulator
- VectorVest Variator
- VectorVest Watchdog
