HOT TOPICS LIST
- MACD
- Fibonacci
- RSI
- Gann
- ADXR
- Stochastics
- Volume
- Triangles
- Futures
- Cycles
- Volatility
- ZIGZAG
- MESA
- Retracement
- Aroon
INDICATORS LIST
LIST OF TOPICS
PRINT THIS ARTICLE
by Gary Grosschadl
Microsoft Corp. fell below its 200-day EMA last February and now has several upside challenges weighing down this giant bellwether stock.
Position: Hold
Gary Grosschadl
Independent Canadian equities trader and technical analyst based in Peterborough
Ontario, Canada.
PRINT THIS ARTICLE
CHART ANALYSIS
Overhead Challenges Facing Microsoft
04/29/05 08:47:56 AMby Gary Grosschadl
Microsoft Corp. fell below its 200-day EMA last February and now has several upside challenges weighing down this giant bellwether stock.
Position: Hold
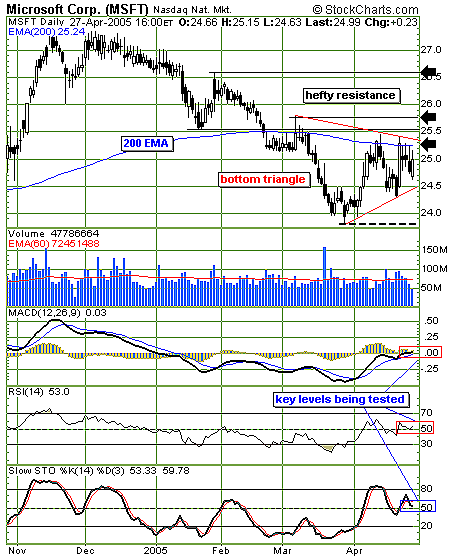
| Microsoft fell below its 200-day exponential moving average (EMA) last February, and it now has several upside challenges weighing down the stock. The daily chart shown in Figure 1 suggests a possible formation of a triangle bottom. However, the most convincing triangle bottoms are not symmetrical; they are ideally ascending triangle bottoms (top of triangle horizontal with rising bottom trendline). The pattern here, however, could easily morph into a possible double-bottom pattern if this small triangle fails. |
| The overall impression I get from this chart is that there is too much overhead resistance offered by the ever-pervasive 200-day EMA, a minor trendline and three lines of resistance (between 25.50 and 26.50). A likely scenario could be a protracted bottom or at least a double-bottom attempt. |

|
| Figure 1: Hefty overhead resistance lessens the chance for a quick turnaround. |
| Graphic provided by: StockCharts.com. |
| |
| A look at three trusted indicators shows key levels being tested in tandem with this test of the 200-day EMA. The moving average convergence/divergence (MACD) is at its often key zero level, a stall here or a successful break higher could be very telling. Note the declining histogram (vertical bars above the MACD lines) hints at a stall. Likewise, the relative strength index (RSI) and the stochastic oscillator are also testing their key 50 levels. |
| With the added pressure of the overall markets suffering a recent downturn, it seems unlikely that Microsoft will forge ahead on its own. Barring any surprise developments, look for a more convincing bottoming pattern before a buy signal develops. |
Independent Canadian equities trader and technical analyst based in Peterborough
Ontario, Canada.
| Website: | www.whatsonsale.ca/financial.html |
| E-mail address: | gwg7@sympatico.ca |
Click here for more information about our publications!
Comments
Date: 04/29/05Rank: 5Comment:

Request Information From Our Sponsors
- StockCharts.com, Inc.
- Candle Patterns
- Candlestick Charting Explained
- Intermarket Technical Analysis
- John Murphy on Chart Analysis
- John Murphy's Chart Pattern Recognition
- John Murphy's Market Message
- MurphyExplainsMarketAnalysis-Intermarket Analysis
- MurphyExplainsMarketAnalysis-Visual Analysis
- StockCharts.com
- Technical Analysis of the Financial Markets
- The Visual Investor
- VectorVest, Inc.
- Executive Premier Workshop
- One-Day Options Course
- OptionsPro
- Retirement Income Workshop
- Sure-Fire Trading Systems (VectorVest, Inc.)
- Trading as a Business Workshop
- VectorVest 7 EOD
- VectorVest 7 RealTime/IntraDay
- VectorVest AutoTester
- VectorVest Educational Services
- VectorVest OnLine
- VectorVest Options Analyzer
- VectorVest ProGraphics v6.0
- VectorVest ProTrader 7
- VectorVest RealTime Derby Tool
- VectorVest Simulator
- VectorVest Variator
- VectorVest Watchdog
