HOT TOPICS LIST
- MACD
- Fibonacci
- RSI
- Gann
- ADXR
- Stochastics
- Volume
- Triangles
- Futures
- Cycles
- Volatility
- ZIGZAG
- MESA
- Retracement
- Aroon
INDICATORS LIST
LIST OF TOPICS
PRINT THIS ARTICLE
by David Penn
The homebuilding boom bumps up against a classic reversal pattern.
Position: N/A
David Penn
Technical Writer for Technical Analysis of STOCKS & COMMODITIES magazine, Working-Money.com, and Traders.com Advantage.
PRINT THIS ARTICLE
HEAD & SHOULDERS
A Head & Shoulders Top In Housing Stocks
04/29/05 10:19:38 AMby David Penn
The homebuilding boom bumps up against a classic reversal pattern.
Position: N/A
| This week, investors got a perfect storm of bad economic news. On the one hand, GDP growth for the first quarter of 2005 was disappointing. On the other hand, a dramatic increase in what they call the "GDP deflator" suggests that economic slowdown or no, inflation is still a problem and Fed funds rate hikes are still likely to be in our economic future. |
| I can't think of a market sector for which this is worse news than the homebuilding sector. Homebuilders have benefited tremendously from the Federal Reserve Board's "accommodative" monetary policy. And we would expect the homebuilders to be disproportionately affected by intimations that not only is the economy slowing down, but also that monetary "accommodation" will no longer be the rule going forward. |

|
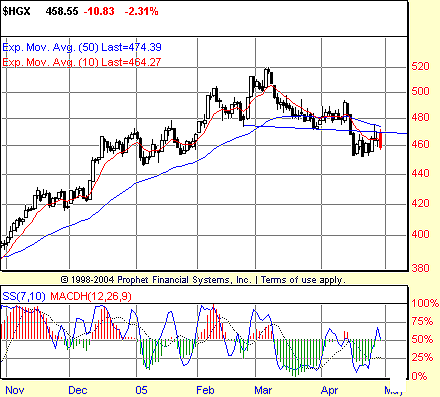
| Figure 1: Negative stochastic divergences in both the "head" and the "right shoulder" of this head & shoulders top pattern only underscore the possibility of a reversal to the downside. |
| Graphic provided by: Prophet Financial, Inc. |
| |
| Traders and investors with a keen eye for pattern recognition in the stock market might have noticed some of this "disproportionate effect" in the form of the head & shoulders top that has been building in the homebuilding sector since early February (Figure 1). In fact, the head & shoulders top in $HGX, the homebuilding stock index, has a number of interesting similarities with the head & shoulders top in the Standard & Poor's 500 that developed over a similar time frame. The most notable likeness between the patterns in the S&P 500 and the $HGX is the small size of the right shoulder compared to both the left shoulder and the head of the formation. Because chart patterns reflect the behavior of thousands or even millions of actors, I've never been one to require exacting Da Vinci-quality patterns--just as it would be senseless to require psychiatrically accurate diagnoses of fear and greed. As such, the head & shoulders pattern here was one I thought to be worthy of note. |
| Current price action seems to be confirming this. After breaking down below the neckline of the head & shoulders pattern in mid-April, $HGX consolidated for a few days before pulling back to make a push upward back above the neckline/breakdown level. Not only has this previous support level now become part of the resistance, but also the 50-day exponential moving average (EMA)--which performed admirably as a level of support during $HGX's ascent from the October 2004 lows--is now looming as resistance. |
| Should resistance at this level prove insurmountable (the level is roughly 470), then the likelihood that $HGX will reach the minimum downside projection of the head & shoulders top would be great. That projection, based on the height of the pattern from the neckline, suggests a downside of about 50 points to the 420 level. |
Technical Writer for Technical Analysis of STOCKS & COMMODITIES magazine, Working-Money.com, and Traders.com Advantage.
| Title: | Technical Writer |
| Company: | Technical Analysis, Inc. |
| Address: | 4757 California Avenue SW |
| Seattle, WA 98116 | |
| Phone # for sales: | 206 938 0570 |
| Fax: | 206 938 1307 |
| Website: | www.Traders.com |
| E-mail address: | DPenn@traders.com |
Traders' Resource Links | |
| Charting the Stock Market: The Wyckoff Method -- Books | |
| Working-Money.com -- Online Trading Services | |
| Traders.com Advantage -- Online Trading Services | |
| Technical Analysis of Stocks & Commodities -- Publications and Newsletters | |
| Working Money, at Working-Money.com -- Publications and Newsletters | |
| Traders.com Advantage -- Publications and Newsletters | |
| Professional Traders Starter Kit -- Software | |
Click here for more information about our publications!
Comments
Date: 04/29/05Rank: 4Comment:

Request Information From Our Sponsors
- StockCharts.com, Inc.
- Candle Patterns
- Candlestick Charting Explained
- Intermarket Technical Analysis
- John Murphy on Chart Analysis
- John Murphy's Chart Pattern Recognition
- John Murphy's Market Message
- MurphyExplainsMarketAnalysis-Intermarket Analysis
- MurphyExplainsMarketAnalysis-Visual Analysis
- StockCharts.com
- Technical Analysis of the Financial Markets
- The Visual Investor
- VectorVest, Inc.
- Executive Premier Workshop
- One-Day Options Course
- OptionsPro
- Retirement Income Workshop
- Sure-Fire Trading Systems (VectorVest, Inc.)
- Trading as a Business Workshop
- VectorVest 7 EOD
- VectorVest 7 RealTime/IntraDay
- VectorVest AutoTester
- VectorVest Educational Services
- VectorVest OnLine
- VectorVest Options Analyzer
- VectorVest ProGraphics v6.0
- VectorVest ProTrader 7
- VectorVest RealTime Derby Tool
- VectorVest Simulator
- VectorVest Variator
- VectorVest Watchdog
