

HOT TOPICS LIST
- MACD
- Fibonacci
- RSI
- Gann
- ADXR
- Stochastics
- Volume
- Triangles
- Futures
- Cycles
- Volatility
- ZIGZAG
- MESA
- Retracement
- Aroon
INDICATORS LIST
LIST OF TOPICS
PRINT THIS ARTICLE
by Gary Grosschadl
Last March, Citibank Inc. fell below its 200-day exponential moving average. Now it's pushed above this important marker once again.
Position: Buy
Gary Grosschadl
Independent Canadian equities trader and technical analyst based in Peterborough
Ontario, Canada.
PRINT THIS ARTICLE
ANDREWS PITCH-FORK
Citigroup Aims Higher
04/28/05 07:40:47 AMby Gary Grosschadl
Last March, Citibank Inc. fell below its 200-day exponential moving average. Now it's pushed above this important marker once again.
Position: Buy
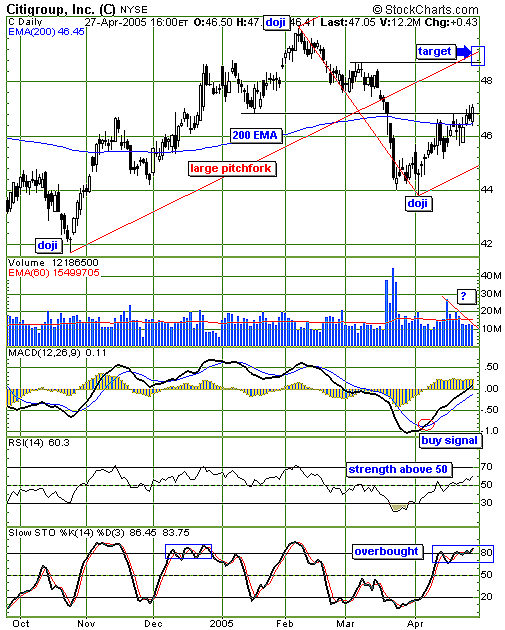
| It wasn't so long ago -- last March, in fact -- that Citibank fell below its 200-day exponential moving average (EMA). Now, it's pushed above this marker once again. An Andrews pitchfork is used to determine an upside target of ~ $49.20. Using three significant turning points, charting software conveniently plots the lines of support and resistance. The pitchfork's parallel lines show an upward bias as long as the lower median line is not violated. The nature of a valid pitchfork pattern is that 80% of the time, a thrust is made to reach the median (center) line. On rarer occasions, a super bull move can launch a drive to the upper median line. However, more often than not, a test of the lower line eventually transpires. Note the three turning ponts all have the telling crosses of a doji or near-doji candlestick. These doji often point to reversals after downlegs and uplegs. |
| Several indicators are showing a somewhat mixed outlook, as you can see in Figure 1. First, the volume pattern is a little suspect. When a stock makes a bullish move past a resistance level, higher volume adds conviction to the move and this is lacking. The stochastic oscillator is also of some concern, as it is in overbought territory. However, as was the case last December, an overbought condition can persist for a longer period of time. On the more bullish side of the equation we have the moving average convergence/divergence (MACD) and the relative strength index (RSI). Both indicators have additional upside room, as the MACD moves above the zero line and the RSI looks strong above its often-key 50 level. |
|
| Figure 1: Daily chart shows that the current bounce has more upside promise. |
| Graphic provided by: StockCharts.com. |
| |
| In conclusion, Citibank has a bullish bias, especially if it can use the 200-day EMA as nearby support, should the stock pause before reloading for an upward test of the target zone. Should the stock close again below its 200-period EMA support, the bears could force a test of the lower median line ~ $45. |
Independent Canadian equities trader and technical analyst based in Peterborough
Ontario, Canada.
| Website: | www.whatsonsale.ca/financial.html |
| E-mail address: | gwg7@sympatico.ca |
Click here for more information about our publications!
Comments
Date:�04/30/05Rank:�5Comment:�

Request Information From Our Sponsors
- StockCharts.com, Inc.
- Candle Patterns
- Candlestick Charting Explained
- Intermarket Technical Analysis
- John Murphy on Chart Analysis
- John Murphy's Chart Pattern Recognition
- John Murphy's Market Message
- MurphyExplainsMarketAnalysis-Intermarket Analysis
- MurphyExplainsMarketAnalysis-Visual Analysis
- StockCharts.com
- Technical Analysis of the Financial Markets
- The Visual Investor
- VectorVest, Inc.
- Executive Premier Workshop
- One-Day Options Course
- OptionsPro
- Retirement Income Workshop
- Sure-Fire Trading Systems (VectorVest, Inc.)
- Trading as a Business Workshop
- VectorVest 7 EOD
- VectorVest 7 RealTime/IntraDay
- VectorVest AutoTester
- VectorVest Educational Services
- VectorVest OnLine
- VectorVest Options Analyzer
- VectorVest ProGraphics v6.0
- VectorVest ProTrader 7
- VectorVest RealTime Derby Tool
- VectorVest Simulator
- VectorVest Variator
- VectorVest Watchdog