HOT TOPICS LIST
- MACD
- Fibonacci
- RSI
- Gann
- ADXR
- Stochastics
- Volume
- Triangles
- Futures
- Cycles
- Volatility
- ZIGZAG
- MESA
- Retracement
- Aroon
INDICATORS LIST
LIST OF TOPICS
PRINT THIS ARTICLE
by David Penn
An excellent example of the "Don't Look Back" breakout develops in a five-minute chart of the emini S&P.
Position: N/A
David Penn
Technical Writer for Technical Analysis of STOCKS & COMMODITIES magazine, Working-Money.com, and Traders.com Advantage.
PRINT THIS ARTICLE
BREAKOUTS
Intraday DLB Breakouts
04/28/05 08:46:24 AMby David Penn
An excellent example of the "Don't Look Back" breakout develops in a five-minute chart of the emini S&P.
Position: N/A
| About a year and a half ago, I wrote an article for Working-Money.com called "Building A Better Breakout" (July 1, 2003), about how Donchian channels could be used to gauge the pullbacks that tend to follow breakouts. |
| The thinking then was straightforward: Pullbacks that did not bring prices back below the breakout level were weaker than those pullbacks that did. Given that weak pullbacks after breakouts tend to signify stronger, more lasting breakouts, I argued that pullbacks that did not slip back below the breakout level would likely lead to more powerful breakouts. |

|
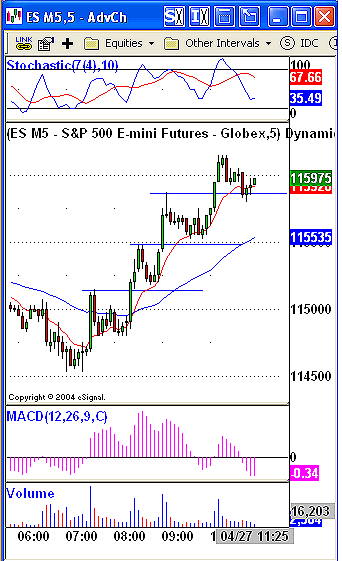
| Figure 1: DLB or "Don't Look Back" breakouts led the emini S&P higher on Wednesday morning. |
| Graphic provided by: eSignal. |
| |
| I called this the "DLB" or "don't look back" breakout, and such breakouts are often the hallmark of strong trends. It is important to note that these breakouts can be found at all levels of activity--from weekly to intraday. This morning, corroboration of that fact appeared in the five-minute chart of the June emini Standard & Poor's 500 futures contract. Note how the five-minute ES would make a new high, pull back, and then go on to make a higher high. In Figure 1, this has happened three times on Wednesday, April 27. Note also how each time there was a breakout to a new high, that bar (or the one immediately preceding or following it) was accompanied by higher volume. |
| Now, note how each time the market pulls back from a new high, it manages to remain above the previous high. The pullbacks near 8:45 am and 9:45 am all retrace a good amount of the breakout, yet do not fall so much as to penetrate the breakout level--which has clearly become support for further advances. How does the DLB party end? The answer: when prices that have been able to produce DLB breakouts begin to have trouble doing so--in other words, when the market begins to show difficulty in sustaining its breakout level--traders and investors should watch and see if a trading or consolidation range is developing. |
| In a worst-case scenario, a market that has been producing DLB breakouts and suddenly stops being able to produce these kind of powerful breakouts could be in danger of not just a consolidation range, but a reversal. In such instances, other technical tools can be helpful in guiding a trader's next move. |
Technical Writer for Technical Analysis of STOCKS & COMMODITIES magazine, Working-Money.com, and Traders.com Advantage.
| Title: | Technical Writer |
| Company: | Technical Analysis, Inc. |
| Address: | 4757 California Avenue SW |
| Seattle, WA 98116 | |
| Phone # for sales: | 206 938 0570 |
| Fax: | 206 938 1307 |
| Website: | www.Traders.com |
| E-mail address: | DPenn@traders.com |
Traders' Resource Links | |
| Charting the Stock Market: The Wyckoff Method -- Books | |
| Working-Money.com -- Online Trading Services | |
| Traders.com Advantage -- Online Trading Services | |
| Technical Analysis of Stocks & Commodities -- Publications and Newsletters | |
| Working Money, at Working-Money.com -- Publications and Newsletters | |
| Traders.com Advantage -- Publications and Newsletters | |
| Professional Traders Starter Kit -- Software | |
Click here for more information about our publications!
Comments
Date: 04/28/05Rank: 3Comment:

Request Information From Our Sponsors
- StockCharts.com, Inc.
- Candle Patterns
- Candlestick Charting Explained
- Intermarket Technical Analysis
- John Murphy on Chart Analysis
- John Murphy's Chart Pattern Recognition
- John Murphy's Market Message
- MurphyExplainsMarketAnalysis-Intermarket Analysis
- MurphyExplainsMarketAnalysis-Visual Analysis
- StockCharts.com
- Technical Analysis of the Financial Markets
- The Visual Investor
- VectorVest, Inc.
- Executive Premier Workshop
- One-Day Options Course
- OptionsPro
- Retirement Income Workshop
- Sure-Fire Trading Systems (VectorVest, Inc.)
- Trading as a Business Workshop
- VectorVest 7 EOD
- VectorVest 7 RealTime/IntraDay
- VectorVest AutoTester
- VectorVest Educational Services
- VectorVest OnLine
- VectorVest Options Analyzer
- VectorVest ProGraphics v6.0
- VectorVest ProTrader 7
- VectorVest RealTime Derby Tool
- VectorVest Simulator
- VectorVest Variator
- VectorVest Watchdog
