HOT TOPICS LIST
- MACD
- Fibonacci
- RSI
- Gann
- ADXR
- Stochastics
- Volume
- Triangles
- Futures
- Cycles
- Volatility
- ZIGZAG
- MESA
- Retracement
- Aroon
INDICATORS LIST
LIST OF TOPICS
PRINT THIS ARTICLE
by Koos van der Merwe
Is the stock worth buying? There are conflicting reports.
Position: Sell
Koos van der Merwe
Has been a technical analyst since 1969, and has worked as a futures and options trader with First Financial Futures in Johannesburg, South Africa.
PRINT THIS ARTICLE
MOVING AVERAGES
Is Placer Dome Worth Buying?
04/28/05 02:42:36 PMby Koos van der Merwe
Is the stock worth buying? There are conflicting reports.
Position: Sell
The following statement was made in an equity research report:"We believe Placer's precipitous recent decline represents an attractive buying opportunity ..." And that is in contrast with a statement from an analyst on a popular TV show: "Placer's decline is because of weakness in the US dollar, with escalating costs. This should continue for some time. ..." |
| Which analyst is correct? Both statements were made by analysts using fundamental data, which does look impressive. In 2004, Placer Dome reported a net income of $284 million or $0.68 per share, up 24% from 2003, with revenues rising to $1.89 billion. The company also has a promising development portfolio of five projects containing more than 42 million ounces of estimated gold resources. On this alone, we can see why at today's price of $13.82, adding the share to our portfolio looks very tempting. However, what do the technicals tell us? |

|
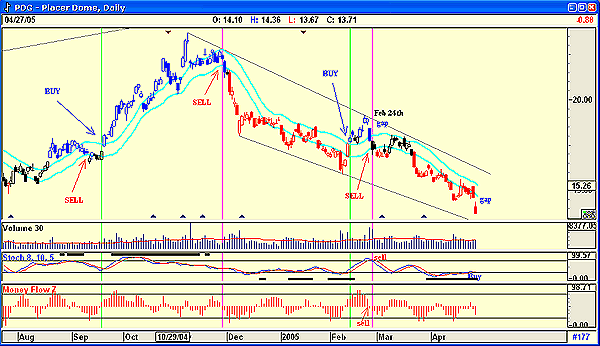
| Figure 1: Is this the demise of Placer Dome? |
| Graphic provided by: AdvancedGET. |
| |
| Figure 1 is a daily chart of Placer Dome with a JM internal band superimposed on the price, a stochastic and money flow indicator plus volume. To recap: The JM internal band is a 15-period moving average offset by 2% positive and -2% negative. A buy signal is given when the price breaks above the upper band, and a sell signal when it breaks below the lower band. I like using this indicator for long-term cautious signals. |
| On Figure 1, I have shown the buy and sell signals as the price moved above or below the bands. I will also look at the indicators when I receive these signals. I have therefore drawn vertical lines across all the indicators, showing their correlation to the buy/sell signals on the JM bands. As of the date on the chart, Placer Dome has gapped down on volume that is slightly higher than the previous day and slightly above the volume average. This is suggesting further selling for the short term. The stochastic indicator has suggested a buy signal by breaking above the 20 level, but until the share price moves above the upper JM band line, I would hold back buying for the long term. The money flow indicator, which suggests the movement of money into and out of a share when it crosses above or below the zero line, is also not suggesting a buy. Finally, the lower trendline is suggesting a fall in the price to test it, which would be in the region of $12.95, if not lower (not shown on chart). The two trendlines are not parallel to each other, narrowing slightly and a pennant formation could be considered, but the length of the pennant is against that surmise. I would not consider it. |
| To conclude, fundamentals tell us what to buy, while technicals tell us when to buy. On Placer Dome, I feel that technicals at the moment do not agree with the analysis made by the fundamentalists; however, the company is worth watching as a possible buy as and when gold starts to strengthen or their costs start decreasing as and if the US dollar strengthens. Whatever the scenario, I would wait for a very definite move above the upper JM band line. |
Has been a technical analyst since 1969, and has worked as a futures and options trader with First Financial Futures in Johannesburg, South Africa.
| Address: | 3256 West 24th Ave |
| Vancouver, BC | |
| Phone # for sales: | 6042634214 |
| E-mail address: | petroosp@gmail.com |
Click here for more information about our publications!
Comments
Date: 04/28/05Rank: 3Comment:
Date: 05/03/05Rank: 4Comment:

|

Request Information From Our Sponsors
- VectorVest, Inc.
- Executive Premier Workshop
- One-Day Options Course
- OptionsPro
- Retirement Income Workshop
- Sure-Fire Trading Systems (VectorVest, Inc.)
- Trading as a Business Workshop
- VectorVest 7 EOD
- VectorVest 7 RealTime/IntraDay
- VectorVest AutoTester
- VectorVest Educational Services
- VectorVest OnLine
- VectorVest Options Analyzer
- VectorVest ProGraphics v6.0
- VectorVest ProTrader 7
- VectorVest RealTime Derby Tool
- VectorVest Simulator
- VectorVest Variator
- VectorVest Watchdog
- StockCharts.com, Inc.
- Candle Patterns
- Candlestick Charting Explained
- Intermarket Technical Analysis
- John Murphy on Chart Analysis
- John Murphy's Chart Pattern Recognition
- John Murphy's Market Message
- MurphyExplainsMarketAnalysis-Intermarket Analysis
- MurphyExplainsMarketAnalysis-Visual Analysis
- StockCharts.com
- Technical Analysis of the Financial Markets
- The Visual Investor
