HOT TOPICS LIST
- MACD
- Fibonacci
- RSI
- Gann
- ADXR
- Stochastics
- Volume
- Triangles
- Futures
- Cycles
- Volatility
- ZIGZAG
- MESA
- Retracement
- Aroon
INDICATORS LIST
LIST OF TOPICS
PRINT THIS ARTICLE
by David Penn
A failed 2B top reversal leads to an ascending triangle breakout.
Position: N/A
David Penn
Technical Writer for Technical Analysis of STOCKS & COMMODITIES magazine, Working-Money.com, and Traders.com Advantage.
PRINT THIS ARTICLE
TRIANGLES
July Cotton's Ascending Triangle Breakout
04/26/05 07:59:33 AMby David Penn
A failed 2B top reversal leads to an ascending triangle breakout.
Position: N/A
| In one sense, the 2B top I discussed at the beginning of April failed ("Cotton Comes Down," Traders.com Advantage, April 1, 2005). At a minimum, I would have expected the decline after the second higher high on March 28 to reach the intrahigh pivot low at 50.53 (from March 21). A cotton trader who got short on April 1 near the 53.75 level, for example, would have been nicely profitable by midday, only to see it completely reversed into a loss if held to the close. |
| In another sense, the 2B top did do what I've learned negative stochastic divergences often do -- namely, these topping patterns occasionally signal not so much a reversal as a significant pause in the advance. When these pauses come in the form of winning short trades that reverse intraday to become losing trades, it might be a good sign that the topping pattern is alerting us to an intermission between acts rather than the final curtain of the show. |

|
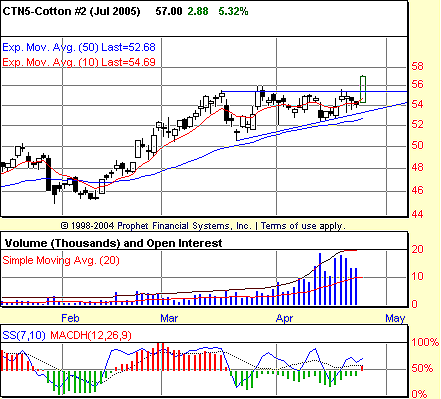
| Figure 1: When the 2B top in mid-March failed to bring significantly lower prices, July cotton moved into a consolidation range with an upwardly sloped support line, forming an ascending triangle. |
| Graphic provided by: Prophet Financial, Inc. |
| |
| The "intermission" appears to be the sideways consolidation that July cotton slipped into during the first half of April (Figure 1). Two things stick out about this consolidation: First, that prices never dipped below the intrapeak, mid-March pivot low. Second, that the consolidation is upwardly sloped from mid-March to mid-April, taking on the form of an ascending triangle. |
| Ascending triangles are one of three different types of triangles that traders and investors will encounter (the other two being descending and symmetrical). Ascending triangles tend to be bullish continuation formations, with a value at their widest part that can be used to anticipate the initial extent of a breakout to the upside. Here, in the case of July cotton, the ascending triangle is approximately five cents at its widest point. Adding five to the value at the top or horizontal resistance level of the triangle (56) provides for a minimum upside of about 61 cents. |
| * A last note: Aside from pattern recognition, the moving average convergence/divergence histogram (MACDH) provided two entry opportunities to the long side--given the failure of the 2B top and the fact that July cotton never closed beneath its 50-day exponential moving average (EMA). The first of these opportunities was on April 8, an up day with increasing volume that set up a long entry at 55.80. The second was on April 18, another up day on increasing volume (relative to the previous two days), which set up another long entry at 55.70. Both of these entry targets would have avoided with back and forth action within the consolidation, yet both would have been "ticked" by the strong advance of the breakout on Monday, April 25. It is also worth pointing out that the current breakout in July cotton is creating a negative stochastic divergence with the high made in the first half of April. While this doesn't necessarily diminish the breakout's validity, it is a development worth watching for if, for example, July cotton fails to reach its minimum upside objective of 61 cents. |
Technical Writer for Technical Analysis of STOCKS & COMMODITIES magazine, Working-Money.com, and Traders.com Advantage.
| Title: | Technical Writer |
| Company: | Technical Analysis, Inc. |
| Address: | 4757 California Avenue SW |
| Seattle, WA 98116 | |
| Phone # for sales: | 206 938 0570 |
| Fax: | 206 938 1307 |
| Website: | www.Traders.com |
| E-mail address: | DPenn@traders.com |
Traders' Resource Links | |
| Charting the Stock Market: The Wyckoff Method -- Books | |
| Working-Money.com -- Online Trading Services | |
| Traders.com Advantage -- Online Trading Services | |
| Technical Analysis of Stocks & Commodities -- Publications and Newsletters | |
| Working Money, at Working-Money.com -- Publications and Newsletters | |
| Traders.com Advantage -- Publications and Newsletters | |
| Professional Traders Starter Kit -- Software | |
Click here for more information about our publications!
Comments
Date: 04/26/05Rank: 3Comment:

|

Request Information From Our Sponsors
- VectorVest, Inc.
- Executive Premier Workshop
- One-Day Options Course
- OptionsPro
- Retirement Income Workshop
- Sure-Fire Trading Systems (VectorVest, Inc.)
- Trading as a Business Workshop
- VectorVest 7 EOD
- VectorVest 7 RealTime/IntraDay
- VectorVest AutoTester
- VectorVest Educational Services
- VectorVest OnLine
- VectorVest Options Analyzer
- VectorVest ProGraphics v6.0
- VectorVest ProTrader 7
- VectorVest RealTime Derby Tool
- VectorVest Simulator
- VectorVest Variator
- VectorVest Watchdog
- StockCharts.com, Inc.
- Candle Patterns
- Candlestick Charting Explained
- Intermarket Technical Analysis
- John Murphy on Chart Analysis
- John Murphy's Chart Pattern Recognition
- John Murphy's Market Message
- MurphyExplainsMarketAnalysis-Intermarket Analysis
- MurphyExplainsMarketAnalysis-Visual Analysis
- StockCharts.com
- Technical Analysis of the Financial Markets
- The Visual Investor
