HOT TOPICS LIST
- MACD
- Fibonacci
- RSI
- Gann
- ADXR
- Stochastics
- Volume
- Triangles
- Futures
- Cycles
- Volatility
- ZIGZAG
- MESA
- Retracement
- Aroon
INDICATORS LIST
LIST OF TOPICS
PRINT THIS ARTICLE
by Gary Grosschadl
Close to multiyear lows, this pharmaceutical company appears to be in accumulation. What are the possible upside targets?
Position: Buy
Gary Grosschadl
Independent Canadian equities trader and technical analyst based in Peterborough
Ontario, Canada.
PRINT THIS ARTICLE
MOVING AVERAGES
Upside Targets For Millennium Pharmaceuticals
04/25/05 09:23:52 AMby Gary Grosschadl
Close to multiyear lows, this pharmaceutical company appears to be in accumulation. What are the possible upside targets?
Position: Buy
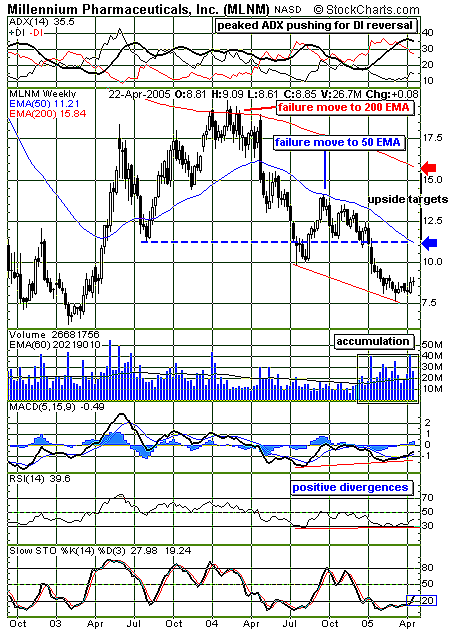
| Stocks under their 200-period moving averages have a lot to prove as they are deemed to be in bear trends. The most conservative traders ignore stocks in this bearish realm. Bolder, shorter-term traders will often take advantage of bear rallies to overhead resistances. I like to refer to these forays as failure moves as a healthy reminder of the heavy negative sentiment. |
| Although fraught with added danger, these moves can be very profitable as in higher risk/higher profit scenarios. Observe the large failure move (bear rally) from 2003 lows below $7 to the 200-period EMA ~ $19, one year later. Now there is another bearish element of this stock also being under its 50-period exponential moving average (EMA). Note that a failure move to this moving average already occurred last September. See Figure 1. |

|
| Figure 1: Weekly chart of MLNM suggests upside "failure" targets. |
| Graphic provided by: StockCharts.com. |
| |
| Various indicators point to a possible upleg from here. The volume pattern suggests accumulation has been building as the bulls seem to be adding positions as the bears may no longer be able to drive this stock further down. Several indicators are also hinting bullish promise. At the top graph, the average directional movement (ADX) has peaked and the directional indexes (DIs) are converging. These are early signs of a turnaround. The moving average convergence/divergence (MACD) indicator and relative strength index (RSI) both show positive divergences to recent price action, and this often portends an upside move. Finally, the stochastics oscillator has risen above the 20 level, which also is an early sign of an upleg under way. |
| Two upside targets are suggested, both overhead resistance levels: the 50- and 200-period EMAs, currently $11.21 and $15.84. A sustained move above the 50 EMA could set up the bolder target, but both are "failure targets." |
Independent Canadian equities trader and technical analyst based in Peterborough
Ontario, Canada.
| Website: | www.whatsonsale.ca/financial.html |
| E-mail address: | gwg7@sympatico.ca |
Click here for more information about our publications!
Comments
Date: 04/25/05Rank: 5Comment:

Request Information From Our Sponsors
- StockCharts.com, Inc.
- Candle Patterns
- Candlestick Charting Explained
- Intermarket Technical Analysis
- John Murphy on Chart Analysis
- John Murphy's Chart Pattern Recognition
- John Murphy's Market Message
- MurphyExplainsMarketAnalysis-Intermarket Analysis
- MurphyExplainsMarketAnalysis-Visual Analysis
- StockCharts.com
- Technical Analysis of the Financial Markets
- The Visual Investor
- VectorVest, Inc.
- Executive Premier Workshop
- One-Day Options Course
- OptionsPro
- Retirement Income Workshop
- Sure-Fire Trading Systems (VectorVest, Inc.)
- Trading as a Business Workshop
- VectorVest 7 EOD
- VectorVest 7 RealTime/IntraDay
- VectorVest AutoTester
- VectorVest Educational Services
- VectorVest OnLine
- VectorVest Options Analyzer
- VectorVest ProGraphics v6.0
- VectorVest ProTrader 7
- VectorVest RealTime Derby Tool
- VectorVest Simulator
- VectorVest Variator
- VectorVest Watchdog
