HOT TOPICS LIST
- MACD
- Fibonacci
- RSI
- Gann
- ADXR
- Stochastics
- Volume
- Triangles
- Futures
- Cycles
- Volatility
- ZIGZAG
- MESA
- Retracement
- Aroon
INDICATORS LIST
LIST OF TOPICS
PRINT THIS ARTICLE
by David Penn
A look at crude oil through the lens of the 60-minute chart suggests a possible reversal in crude oil's bull run.
Position: N/A
David Penn
Technical Writer for Technical Analysis of STOCKS & COMMODITIES magazine, Working-Money.com, and Traders.com Advantage.
PRINT THIS ARTICLE
HEAD & SHOULDERS
Crude Oil's Hourly Head And Shoulders Top
04/25/05 09:28:03 AMby David Penn
A look at crude oil through the lens of the 60-minute chart suggests a possible reversal in crude oil's bull run.
Position: N/A
| Writing in his Encyclopedia Of Chart Patterns, Thomas Bulkowski mentions a "surprising finding" with regard to head & shoulders tops: "A down-sloping neckline or a lower right shoulder (versus left shoulder) predicts a larger decline, but results are not statistically significant." |
| Later, he adds in an observation about a specific head & shoulders top in Toll Brothers more than a decade ago: "The down-sloping neckline suggests an especially weak situation." |

|
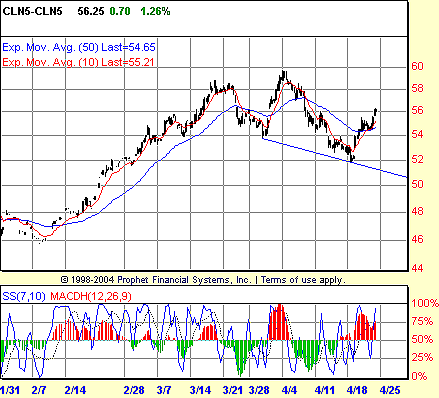
| Figure 1: Crude oil. The downwardly sloped neckline suggests that a break below the low 50s could be severe for July crude oil futures. Note the negative stochastic divergence that is developing in the right shoulder of the potential pattern. |
| Graphic provided by: Prophet Financial, Inc. |
| |
| I think about this as I look at the chart of July crude oil futures (Figure 1). The potential head & shoulders top in the daily charts seems well on its way toward completing a right shoulder. The neckline, which starts on March 30 at 54 and runs through to April 18 at 52, is especially sloped downward--so much so that I had to check both Robert Edwards and John Magee's Technical Analysis Of Stock Trends and Bulkowski to confirm the validity of such an exaggeratedly downward neckline. Statistical reservations aside, it seems as if crude oil does move down and through the lower, right-hand side of the neckline, and then a head & shoulders top will be complete. What I was also looking for was technical evidence that the right shoulder--as a pattern in and of itself--might be topping. Specifically, I was hoping a negative stochastic divergence might be visible at a slightly shorter-time frame, a divergence that would be bearish for the rally since mid-April that makes up the right shoulder of this potential reversal pattern. |
| That negative stochastic is very much in play. The consecutively higher highs on April 20 and 22 in price are matched with--so far--consecutively lower highs in the 7,10 stochastic. What would be required would be for the stochastic to turn down on or shortly after April 22 without making a higher high vis-a-vis the level of the stochastic on April 20. While a top could still form without a negative stochastic divergence, the divergence remains a worthwhile sign to be on guard for--insofar as major tops are often characterized by this kind of pattern in the stochastic. |
| A last note: One thing that would have been bullish for crude oil futures would have been a positive stochastic divergence on the daily charts between the lows of March 30 and April 18. The fact that such a divergence did not occur helps create room for the reversal thesis I have outlined. |
Technical Writer for Technical Analysis of STOCKS & COMMODITIES magazine, Working-Money.com, and Traders.com Advantage.
| Title: | Technical Writer |
| Company: | Technical Analysis, Inc. |
| Address: | 4757 California Avenue SW |
| Seattle, WA 98116 | |
| Phone # for sales: | 206 938 0570 |
| Fax: | 206 938 1307 |
| Website: | www.Traders.com |
| E-mail address: | DPenn@traders.com |
Traders' Resource Links | |
| Charting the Stock Market: The Wyckoff Method -- Books | |
| Working-Money.com -- Online Trading Services | |
| Traders.com Advantage -- Online Trading Services | |
| Technical Analysis of Stocks & Commodities -- Publications and Newsletters | |
| Working Money, at Working-Money.com -- Publications and Newsletters | |
| Traders.com Advantage -- Publications and Newsletters | |
| Professional Traders Starter Kit -- Software | |
Click here for more information about our publications!
Comments
Date: 04/25/05Rank: 3Comment:

Request Information From Our Sponsors
- StockCharts.com, Inc.
- Candle Patterns
- Candlestick Charting Explained
- Intermarket Technical Analysis
- John Murphy on Chart Analysis
- John Murphy's Chart Pattern Recognition
- John Murphy's Market Message
- MurphyExplainsMarketAnalysis-Intermarket Analysis
- MurphyExplainsMarketAnalysis-Visual Analysis
- StockCharts.com
- Technical Analysis of the Financial Markets
- The Visual Investor
- VectorVest, Inc.
- Executive Premier Workshop
- One-Day Options Course
- OptionsPro
- Retirement Income Workshop
- Sure-Fire Trading Systems (VectorVest, Inc.)
- Trading as a Business Workshop
- VectorVest 7 EOD
- VectorVest 7 RealTime/IntraDay
- VectorVest AutoTester
- VectorVest Educational Services
- VectorVest OnLine
- VectorVest Options Analyzer
- VectorVest ProGraphics v6.0
- VectorVest ProTrader 7
- VectorVest RealTime Derby Tool
- VectorVest Simulator
- VectorVest Variator
- VectorVest Watchdog
