HOT TOPICS LIST
- MACD
- Fibonacci
- RSI
- Gann
- ADXR
- Stochastics
- Volume
- Triangles
- Futures
- Cycles
- Volatility
- ZIGZAG
- MESA
- Retracement
- Aroon
INDICATORS LIST
LIST OF TOPICS
PRINT THIS ARTICLE
by Koos van der Merwe
A popular newsletter writer in his report has suggested that he believes the Canadian dollar will go to parity with the US dollar. I don't see it, but then...
Position: Accumulate
Koos van der Merwe
Has been a technical analyst since 1969, and has worked as a futures and options trader with First Financial Futures in Johannesburg, South Africa.
PRINT THIS ARTICLE
ELLIOTT WAVE
Canadian Dollar At Parity?
04/22/05 08:43:06 AMby Koos van der Merwe
A popular newsletter writer in his report has suggested that he believes the Canadian dollar will go to parity with the US dollar. I don't see it, but then...
Position: Accumulate
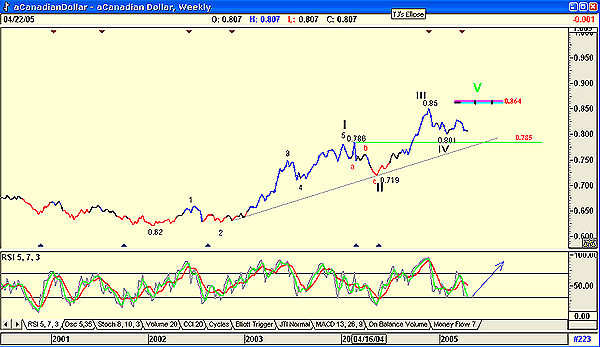
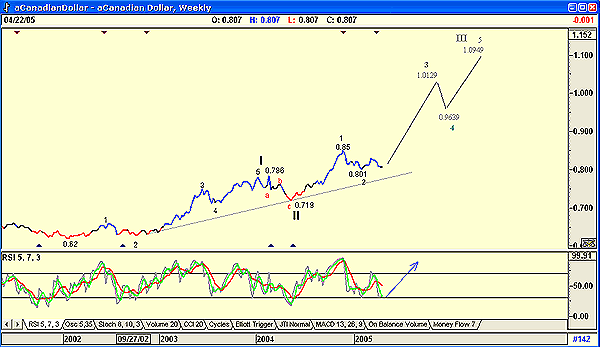
Figure 1 is a weekly chart of the Canadian dollar, with my suggested wave count. The count is unusual in that wave 3 is shorter than wave 1, which means that wave 5 must be shorter than wave 3. The make or break (MOB) target indicator confirms this, with the wave 5 target of C$0.864 to the US dollar.  Figure 1: Canadian dollar, weekly chart. The MOB study of Advanced GET is an excellent tool that can help us find the target price area for the end of an Elliott wave 5, or for any pattern that has an impulse-correction-impulse pattern. This chart is my primary count and looks feasible, even with the unusual wave count. However, as every Elliottician knows, there is always an alternate chart in our back pocket. Figure 2 shows what I believe is totally unfeasible. |
| My calculations for future targets in Figure 2 are as follows. Wave 0 - 0.719 Wave 1 - 0.85 = 0.131 - (0.85 - 0.719) Wave 2 - 0.801 = 0.049 - (0.85 - 0.801) Wave 3 - Wave 1 x 1.618 = 0.131 x 1.618 = 0.2119 + 0.801 = 1.0129 Wave 4 - Wave 2 = 0.049 = 1.0129 - 0.049 = 0.9639 Wave 5 - Wave 1 = 0.131 + 0.9639 = 1.0949 |

|
| Figure 2: Canadian dollar, alternative weekly chart |
| Graphic provided by: AdvancedGET. |
| |
| Wave 5 would be the top of wave III, which would then project wave V as high as 1.2119 to the US dollar. This looks very unfeasible, and I far prefer using the more conservative target count of Figure 1. |
| Although many pundits are calling for a Canadian dollar at parity with the US dollar, I cannot see it. My first Elliott chart (Figure 1), with its unusual wave count, looks far more acceptable than the count in Figure 2. |
Has been a technical analyst since 1969, and has worked as a futures and options trader with First Financial Futures in Johannesburg, South Africa.
| Address: | 3256 West 24th Ave |
| Vancouver, BC | |
| Phone # for sales: | 6042634214 |
| E-mail address: | petroosp@gmail.com |
Click here for more information about our publications!
Comments
Date: 04/22/05Rank: 2Comment:
Date: 04/26/05Rank: 2Comment:

Request Information From Our Sponsors
- StockCharts.com, Inc.
- Candle Patterns
- Candlestick Charting Explained
- Intermarket Technical Analysis
- John Murphy on Chart Analysis
- John Murphy's Chart Pattern Recognition
- John Murphy's Market Message
- MurphyExplainsMarketAnalysis-Intermarket Analysis
- MurphyExplainsMarketAnalysis-Visual Analysis
- StockCharts.com
- Technical Analysis of the Financial Markets
- The Visual Investor
- VectorVest, Inc.
- Executive Premier Workshop
- One-Day Options Course
- OptionsPro
- Retirement Income Workshop
- Sure-Fire Trading Systems (VectorVest, Inc.)
- Trading as a Business Workshop
- VectorVest 7 EOD
- VectorVest 7 RealTime/IntraDay
- VectorVest AutoTester
- VectorVest Educational Services
- VectorVest OnLine
- VectorVest Options Analyzer
- VectorVest ProGraphics v6.0
- VectorVest ProTrader 7
- VectorVest RealTime Derby Tool
- VectorVest Simulator
- VectorVest Variator
- VectorVest Watchdog
