HOT TOPICS LIST
- MACD
- Fibonacci
- RSI
- Gann
- ADXR
- Stochastics
- Volume
- Triangles
- Futures
- Cycles
- Volatility
- ZIGZAG
- MESA
- Retracement
- Aroon
INDICATORS LIST
LIST OF TOPICS
PRINT THIS ARTICLE
by Kevin Hopson
Bullish divergences and pessimistic market sentiment both point to a forthcoming reversal.
Position: N/A
Kevin Hopson
Kevin has been a technical analyst for roughly 10 years now. Previously, Kevin owned his own business and acted as a registered investment advisor, specializing in energy. He was also a freelance oil analyst for Orient Trading Co., a commodity futures trading firm in Japan. Kevin is currently a freelance writer.
PRINT THIS ARTICLE
TECHNICAL ANALYSIS
A Developing Bottom For Wachovia Corp.?
04/22/05 07:30:00 AMby Kevin Hopson
Bullish divergences and pessimistic market sentiment both point to a forthcoming reversal.
Position: N/A
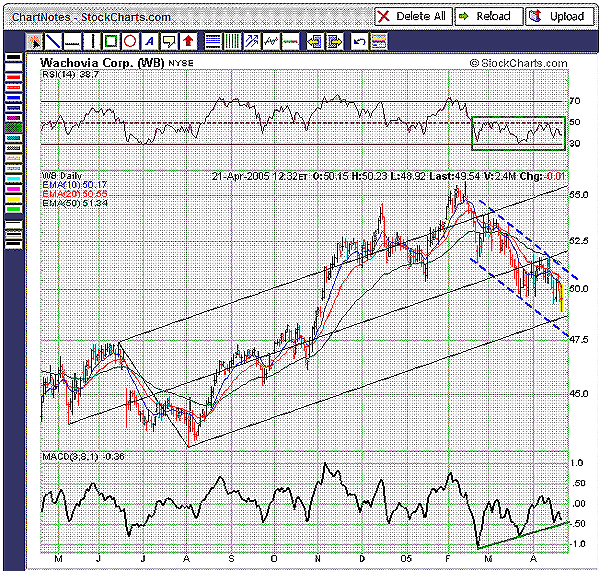
| Wachovia Corp. (WB) has been in a defined downtrend since February 2005, as illustrated by the dotted blue lines (falling channel) in the one-year chart (Figure 1). However, the stock may be putting in a bottom right now, as bullish divergences and pessimistic market sentiment both point to a forthcoming reversal. More specifically, note how the relative strength index (RSI) has been trading sideways since the February low. In addition, the moving average convergence/divergence (MACD) has been putting in higher lows. These patterns are occurring despite the fact that prices have continued to hit new year-to-date lows. When you see bullish divergences like these, they usually signal a developing bottom. |
| Adding to the "bottom" theory is current market sentiment toward the stock. For example, short interest for Wachovia was 20.1 million shares as of March 8, which equates to a short interest ratio of roughly 5.4 times. In addition, the stock's put/call open interest ratio for the front three months is 1.53 times, which is higher than 99% of the readings over the past year. Further, 42% of the analysts covering Wachovia still have a hold or sell rating on the company. Because market sentiment tends to be the most pessimistic at bottoms, it appears that Wachovia has much more upside potential here than downside risk. The stock also has much more possible buying pressure to push it higher. |

|
| Figure 1: Wachovia Bank, one-year chart. Wachovia has been in a defined downtrend since February 2005, as illustrated by the dotted blue lines (falling channel). However, the stock may be putting in a bottom right now, as bullish divergences and pessimistic market sentiment both point to a forthcoming reversal. |
| Graphic provided by: StockCharts.com. |
| |
| The problem now is determining where the ultimate bottom will occur. Though it is nearly impossible to predict this, there are two key support levels to keep your eye on. The first is the $48.75 level, which is the site of the bottom black parallel line. The second is the $47.50 level, which is the site of the bottom blue trendline and significant put option open interest. Buying at either of these levels, assuming the opportunity presents itself, would likely prove beneficial to long-term investors. |
Kevin has been a technical analyst for roughly 10 years now. Previously, Kevin owned his own business and acted as a registered investment advisor, specializing in energy. He was also a freelance oil analyst for Orient Trading Co., a commodity futures trading firm in Japan. Kevin is currently a freelance writer.
| Glen Allen, VA | |
| E-mail address: | hopson_1@yahoo.com |
Click here for more information about our publications!
Comments
Date: 04/22/05Rank: 4Comment:

|

Request Information From Our Sponsors
- StockCharts.com, Inc.
- Candle Patterns
- Candlestick Charting Explained
- Intermarket Technical Analysis
- John Murphy on Chart Analysis
- John Murphy's Chart Pattern Recognition
- John Murphy's Market Message
- MurphyExplainsMarketAnalysis-Intermarket Analysis
- MurphyExplainsMarketAnalysis-Visual Analysis
- StockCharts.com
- Technical Analysis of the Financial Markets
- The Visual Investor
- VectorVest, Inc.
- Executive Premier Workshop
- One-Day Options Course
- OptionsPro
- Retirement Income Workshop
- Sure-Fire Trading Systems (VectorVest, Inc.)
- Trading as a Business Workshop
- VectorVest 7 EOD
- VectorVest 7 RealTime/IntraDay
- VectorVest AutoTester
- VectorVest Educational Services
- VectorVest OnLine
- VectorVest Options Analyzer
- VectorVest ProGraphics v6.0
- VectorVest ProTrader 7
- VectorVest RealTime Derby Tool
- VectorVest Simulator
- VectorVest Variator
- VectorVest Watchdog
