HOT TOPICS LIST
- MACD
- Fibonacci
- RSI
- Gann
- ADXR
- Stochastics
- Volume
- Triangles
- Futures
- Cycles
- Volatility
- ZIGZAG
- MESA
- Retracement
- Aroon
INDICATORS LIST
LIST OF TOPICS
PRINT THIS ARTICLE
by David Penn
Is this just the universal cry of gamblers, or what the bear market is doing to casino and gaming stocks?
Position: N/A
David Penn
Technical Writer for Technical Analysis of STOCKS & COMMODITIES magazine, Working-Money.com, and Traders.com Advantage.
PRINT THIS ARTICLE
MOVING AVERAGES
Beat The House!
04/21/05 10:34:45 AMby David Penn
Is this just the universal cry of gamblers, or what the bear market is doing to casino and gaming stocks?
Position: N/A
| I suspect that like a lot of people who migrate toward the trading world, I'm not alone in having spent a few years in my 20s figuring out how I was going to become a professional gambler in Las Vegas. While those specific dreams never reached fruition, I realize now that being where I am and doing what I'm doing is probably as close to those 20-something fantasies as I'll ever get--or need to get. |
| So there's a little something funny about looking at price charts of casinos--sort of like imagining the doctor visiting his dentist. Unfortunately for holders of shares of Wynn Resorts, there is very little funny about the price chart that casino's stock is providing. |

|
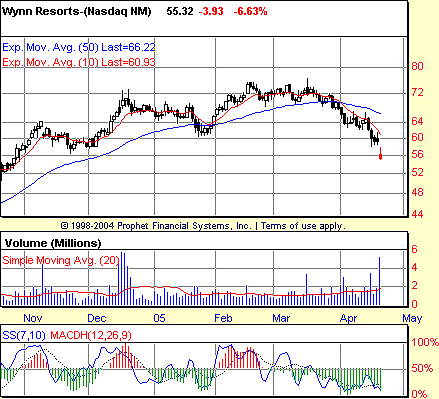
| Figure 1: Wynn Resorts made its closing high in February, and closed beneath its 50-day EMA in March. But the gap down on big volume in April might be the straw that breaks this camel's back. |
| Graphic provided by: Prophet Financial, Inc. |
| |
| WYNN has been showing weakness since the autumn of 2004. The negative stochastic divergences between November and December actually anticipated the sideways, bearish market from mid-December to the end of January. Similarly, shorter-term negative stochastic divergences in February suggested that WYNN would continue to have difficulty moving appreciably higher. Thus, it should have been little surprise to see WYNN slip below its 50-day exponential moving average (EMA) in late March and continue that weakness into April. The punctuation mark of weakness was the gap down on overwhelming volume on Wednesday, April 20, a move that saw the stock plunge decisively below potential support at the $60 level. (If truth be told, WYNN had closed marginally below this level on Monday and Tuesday before Wednesday's collapse.) |
| Measured from the top of its sideways action throughout 2005 to the now-violated support level at $60, that was a swing down some 12 to 14 points to the $48 or $46 level. Such a decline could actually allow WYNN to close a smallish gap from back in late September 2004--a gap that was one of the key bullish signals as the stock moved higher along with the rest of the market in autumn 2004. |
| What is most interesting about WYNN is that it is hardly alone among casinos and gaming stocks getting hammered in recent days. Among the top 12 in terms of market capitalization, six others are trading beneath their 50-day EMAs--and not trading especially well below that moving average either. Those six include: IGT, KZL, LVS, MGG, SGMS, and SHFL. |
Technical Writer for Technical Analysis of STOCKS & COMMODITIES magazine, Working-Money.com, and Traders.com Advantage.
| Title: | Technical Writer |
| Company: | Technical Analysis, Inc. |
| Address: | 4757 California Avenue SW |
| Seattle, WA 98116 | |
| Phone # for sales: | 206 938 0570 |
| Fax: | 206 938 1307 |
| Website: | www.Traders.com |
| E-mail address: | DPenn@traders.com |
Traders' Resource Links | |
| Charting the Stock Market: The Wyckoff Method -- Books | |
| Working-Money.com -- Online Trading Services | |
| Traders.com Advantage -- Online Trading Services | |
| Technical Analysis of Stocks & Commodities -- Publications and Newsletters | |
| Working Money, at Working-Money.com -- Publications and Newsletters | |
| Traders.com Advantage -- Publications and Newsletters | |
| Professional Traders Starter Kit -- Software | |
Click here for more information about our publications!
Comments
Date: 04/22/05Rank: 3Comment:

Request Information From Our Sponsors
- VectorVest, Inc.
- Executive Premier Workshop
- One-Day Options Course
- OptionsPro
- Retirement Income Workshop
- Sure-Fire Trading Systems (VectorVest, Inc.)
- Trading as a Business Workshop
- VectorVest 7 EOD
- VectorVest 7 RealTime/IntraDay
- VectorVest AutoTester
- VectorVest Educational Services
- VectorVest OnLine
- VectorVest Options Analyzer
- VectorVest ProGraphics v6.0
- VectorVest ProTrader 7
- VectorVest RealTime Derby Tool
- VectorVest Simulator
- VectorVest Variator
- VectorVest Watchdog
- StockCharts.com, Inc.
- Candle Patterns
- Candlestick Charting Explained
- Intermarket Technical Analysis
- John Murphy on Chart Analysis
- John Murphy's Chart Pattern Recognition
- John Murphy's Market Message
- MurphyExplainsMarketAnalysis-Intermarket Analysis
- MurphyExplainsMarketAnalysis-Visual Analysis
- StockCharts.com
- Technical Analysis of the Financial Markets
- The Visual Investor
