HOT TOPICS LIST
- MACD
- Fibonacci
- RSI
- Gann
- ADXR
- Stochastics
- Volume
- Triangles
- Futures
- Cycles
- Volatility
- ZIGZAG
- MESA
- Retracement
- Aroon
INDICATORS LIST
LIST OF TOPICS
PRINT THIS ARTICLE
by Jason K. Hutson
Use a risk-reward ratio to narrow down your investment decisions.
Position: N/A
Jason K. Hutson
Traders.com Staff Writer. Enjoys trendlines, support and resistance, moving averages, RSI, MACD, ADX, Bollinger bands, parabolic SAR, chart formations, and volume analysis.
PRINT THIS ARTICLE
MONEY MANAGEMENT
Approximate Your Risk Before You Trade
06/26/00 11:37:47 AMby Jason K. Hutson
Use a risk-reward ratio to narrow down your investment decisions.
Position: N/A
| Investors can separate their capital between these common investment vehicles: savings accounts, money market accounts, treasury bonds, certificates of deposit (CD's), insurance, real estate, mutual funds, stocks, options, and futures. Each one of the investment vehicles described above has different risk-reward ratios. The lower the ratio the better the investment. Risk-reward ratios should only be used to compare investment vehicles of the same type. If you are comparing investments with ratios of 0 then you can rank the options strictly by the reward. Finding the risk-reward ratio is simple. Take the potential loss of value and divide it by the potential gain of value to find the risk-reward ratio. potentialLoss / potentialGain = risk-reward ratio. |
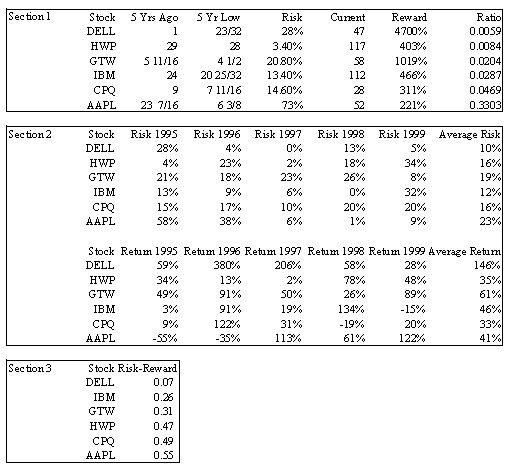
| Now that you have an idea about how to calculate a risk-reward ratio, choose an investment vehicle and create risk-reward ratios for all of your options. In the example below the vehicle was purchasing common stock and we wanted to compare our options for investments. We have a time frame of 5 years. Six stocks where selected and the approximate risks and approximate rewards calculated. Then the risk-reward ratios where computed using the equation above. The lower the ratio the better the investment has performed in the past in terms of risk-reward. If the risk-reward ratio is equal to 1 then the risks equal the rewards. If the risks are greater than the rewards the risk-reward ratio will be larger than 1. If the rewards exceed the risks the ratio will be smaller than 1. |

|
| Section 1 is the 5 year risk-reward analysis. Section 2 is risk and reward analysis for each year. Section 3 is the risk-reward ratios for section 2. |
| |
| You calculate the risk-reward ratios so that you can compare all your options. Use at least 5 years of data, it is wise to use more data because you can increase the validity and significance of your sample approximations. Do not go back too far in history though because over time the likelihood of the past repeating itself decreases. First find the 5 year low for each stock. Then divide the 5 year low by the price of the stock 5 years ago, this is the approximate risk. You find the approximate reward percentage by dividing the current price by the price from 5 years ago. |
| By doing this same type of analysis for shorter increments of time you will be able to come up with better approximations for reward and risk. This method involves more time gathering the data but can increase your knowledge about the risks involved. In the example below the risk and reward is figured out for each year. You may also break down the investment risk and rewards into months, weeks or days depending on your time frame. |
| In the second more elaborate analysis AAPL was still ranked the lowest in terms of risk-reward and DELL was still ranked the highest. The most interesting drop in the ranking after taking a closer look was HWP. HWP has had a couple years where the approximate risk was very high. The risk average was much larger looking at individual years. Over the full five-year period HWP performed well, but the year to year investment risk was much higher than anticipated than with the first analysis. In conclusion finding the risk-reward ratio's can help you rank your investment options. |
Traders.com Staff Writer. Enjoys trendlines, support and resistance, moving averages, RSI, MACD, ADX, Bollinger bands, parabolic SAR, chart formations, and volume analysis.
| Title: | Industrial Engineer |
| Company: | Technical Analysis, Inc. |
| Address: | 4757 California Ave SW |
| Seattle, WA 98116 | |
| Phone # for sales: | 206 938 0570 |
| Website: | Traders.com |
| E-mail address: | JasonHutson@Traders.com |
Traders' Resource Links | |
| Charting the Stock Market: The Wyckoff Method -- Books | |
| Working-Money.com -- Online Trading Services | |
| Traders.com Advantage -- Online Trading Services | |
| Technical Analysis of Stocks & Commodities -- Publications and Newsletters | |
| Working Money, at Working-Money.com -- Publications and Newsletters | |
| Traders.com Advantage -- Publications and Newsletters | |
| Professional Traders Starter Kit -- Software | |
Click here for more information about our publications!
Comments

Request Information From Our Sponsors
- StockCharts.com, Inc.
- Candle Patterns
- Candlestick Charting Explained
- Intermarket Technical Analysis
- John Murphy on Chart Analysis
- John Murphy's Chart Pattern Recognition
- John Murphy's Market Message
- MurphyExplainsMarketAnalysis-Intermarket Analysis
- MurphyExplainsMarketAnalysis-Visual Analysis
- StockCharts.com
- Technical Analysis of the Financial Markets
- The Visual Investor
- VectorVest, Inc.
- Executive Premier Workshop
- One-Day Options Course
- OptionsPro
- Retirement Income Workshop
- Sure-Fire Trading Systems (VectorVest, Inc.)
- Trading as a Business Workshop
- VectorVest 7 EOD
- VectorVest 7 RealTime/IntraDay
- VectorVest AutoTester
- VectorVest Educational Services
- VectorVest OnLine
- VectorVest Options Analyzer
- VectorVest ProGraphics v6.0
- VectorVest ProTrader 7
- VectorVest RealTime Derby Tool
- VectorVest Simulator
- VectorVest Variator
- VectorVest Watchdog
