HOT TOPICS LIST
- MACD
- Fibonacci
- RSI
- Gann
- ADXR
- Stochastics
- Volume
- Triangles
- Futures
- Cycles
- Volatility
- ZIGZAG
- MESA
- Retracement
- Aroon
INDICATORS LIST
LIST OF TOPICS
PRINT THIS ARTICLE
by Arthur Hill
The uptrend in long-term rates remains intact, but a sudden lower high has put it in jeopardy.
Position: Hold
Arthur Hill
Arthur Hill is currently editor of TDTrader.com, a website specializing in trading strategies, sector/industry specific breadth stats and overall technical analysis. He passed the Society of Technical Analysts (STA London) diploma exam with distinction is a Certified Financial Technician (CFTe). Prior to TD Trader, he was the Chief Technical Analyst for Stockcharts.com and the main contributor to the ChartSchool.
PRINT THIS ARTICLE
TRIANGLES
Interest Rate Advance Suddenly Stalls
04/21/05 08:17:28 AMby Arthur Hill
The uptrend in long-term rates remains intact, but a sudden lower high has put it in jeopardy.
Position: Hold
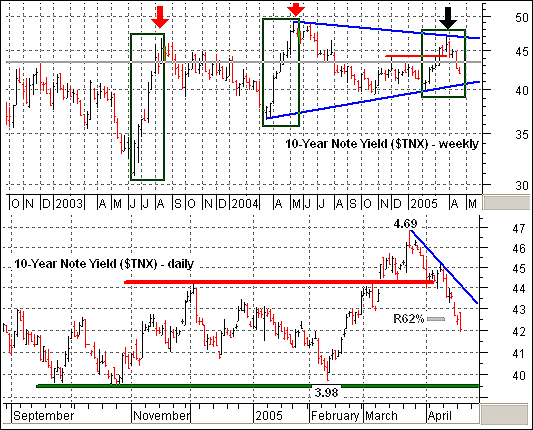
| After a sharp rise in February and March 2005, the 10-year Treasury note yield stalled and pulled back sharply. Note that the prior advances (June-August 2003 and March-May 2004) were very sharp and forged higher highs (red arrows). The current advance started just as strong, but fizzled after seven weeks and formed a lower high (black arrows). The result is a large triangle pattern in the works and the long-term trend for TNX is in jeopardy. |
| Triangles are neutral patterns that denote a consolidation. In fact, TNX seems to be pretty good at the consolidation game, as it has traded on either side of 4.35% for almost three years (gray line) (Figure 1). Resolution of this triangle will dictate the next long-term move. A break above 4.7% would be bullish and a break below 3.95% would be bearish. |

|
| Figure 1: 10-Year Note Yield. Triangles are neutral patterns that denote a consolidation. In fact, TNX seems to be pretty good at the consolidation game, as it has traded on either side of 4.35% for almost three years (gray line). |
| Graphic provided by: MetaStock. |
| Graphic provided by: Reuters Data. |
| |
| Homing in on the daily chart, we can see that TNX is a critical point. TNX broke resistance around 4.4% with a big advance in February and March. Broken resistance usually turns into support, but this level failed and the decline extended to around 4.2%. The current decline has retraced 62% of the prior advance. Normal retracements are 38-62%, and this retracement is at its make-or-break point. Further weakness would be deemed excessive and increase the odds of a support break at 3.95%. |
Arthur Hill is currently editor of TDTrader.com, a website specializing in trading strategies, sector/industry specific breadth stats and overall technical analysis. He passed the Society of Technical Analysts (STA London) diploma exam with distinction is a Certified Financial Technician (CFTe). Prior to TD Trader, he was the Chief Technical Analyst for Stockcharts.com and the main contributor to the ChartSchool.
| Title: | Editor |
| Company: | TDTrader.com |
| Address: | Willem Geetsstraat 17 |
| Mechelen, B2800 | |
| Phone # for sales: | 3215345465 |
| Website: | www.tdtrader.com |
| E-mail address: | arthurh@tdtrader.com |
Traders' Resource Links | |
| TDTrader.com has not added any product or service information to TRADERS' RESOURCE. | |
Click here for more information about our publications!
Comments
Date: 04/22/05Rank: 4Comment:

|

Request Information From Our Sponsors
- StockCharts.com, Inc.
- Candle Patterns
- Candlestick Charting Explained
- Intermarket Technical Analysis
- John Murphy on Chart Analysis
- John Murphy's Chart Pattern Recognition
- John Murphy's Market Message
- MurphyExplainsMarketAnalysis-Intermarket Analysis
- MurphyExplainsMarketAnalysis-Visual Analysis
- StockCharts.com
- Technical Analysis of the Financial Markets
- The Visual Investor
- VectorVest, Inc.
- Executive Premier Workshop
- One-Day Options Course
- OptionsPro
- Retirement Income Workshop
- Sure-Fire Trading Systems (VectorVest, Inc.)
- Trading as a Business Workshop
- VectorVest 7 EOD
- VectorVest 7 RealTime/IntraDay
- VectorVest AutoTester
- VectorVest Educational Services
- VectorVest OnLine
- VectorVest Options Analyzer
- VectorVest ProGraphics v6.0
- VectorVest ProTrader 7
- VectorVest RealTime Derby Tool
- VectorVest Simulator
- VectorVest Variator
- VectorVest Watchdog
