HOT TOPICS LIST
- MACD
- Fibonacci
- RSI
- Gann
- ADXR
- Stochastics
- Volume
- Triangles
- Futures
- Cycles
- Volatility
- ZIGZAG
- MESA
- Retracement
- Aroon
INDICATORS LIST
LIST OF TOPICS
PRINT THIS ARTICLE
by Koos van der Merwe
Martha is definitely the comeback kid... and I can guarantee you that her ankle bracelet will soon be fashionable. What does the latest chart say?
Position: Buy
Koos van der Merwe
Has been a technical analyst since 1969, and has worked as a futures and options trader with First Financial Futures in Johannesburg, South Africa.
PRINT THIS ARTICLE
STOCHASTICS
Martha Stewart, The Comeback Kid
04/20/05 07:41:22 AMby Koos van der Merwe
Martha is definitely the comeback kid... and I can guarantee you that her ankle bracelet will soon be fashionable. What does the latest chart say?
Position: Buy
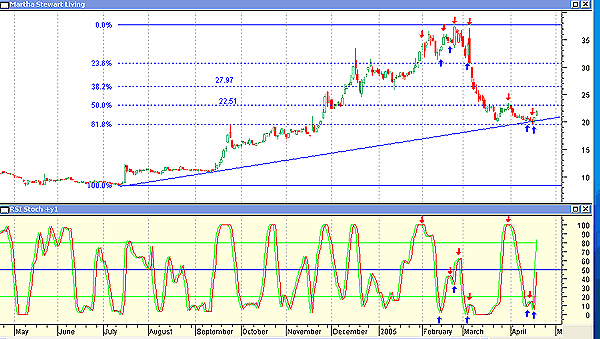
| In an earlier article ("MSO At A Low?" March 24, Traders.com Advantage), I suggested that the stock price had been oversold and was due for a correction. Since then, the stock price has fallen even further, by a couple of dollars, but Figure 1 suggests that Martha is on the comeback trail, especially with a radio show aimed specifically at women--Howard Stern, beware. Let us look at what the chart says. |
| Figure 1 is a candlestick chart with the indicator -- a stochastic + relative strength index (RSI), but with a difference. The trigger for the indicator is the previous day's indicator (red line). Here is the formula for the indicator in MetaStock: StRs:=((Sum(RSI(10)-LLV(RSI(10),10),3)/Sum(HHV(RSI(10),10)-LLV(RSI(10),10),3))*100); 80; 50; 20; StRs; Ref(StRs,-1) I have also drawn the dominant support line, and Fibonacci levels from the low to the high. Note the following: a. The price has fallen to test--penetrate and retrace the long-term support line. b. The price fell to and tested the 61.8% Fibonacci level. Retracement targets are the 50% level at $22.51 and the 38.2% at $27.97. c. I have shown buy and sell indicators suggested by the stochastic-RSI. Note two things: 1. Short-term traders would have traded as the red line crossed the green line. 2. Longer-term traders could have waited for the indicator to cross the 50-level mark before following the suggested signal. |

|
| Figure 1: Martha Stewart Omnimedia and indicators |
| Graphic provided by: MetaStock. |
| |
| The risk is the overall market and the state of the US economy. Should the Dow Jones Industrial Average continue falling and move into a major bear market, no matter how good the company, the trend will be down as investors run to safe haven. Is Martha Stewart Living Omnimedia (MSO) a buy at this price? I believe so, simply on her personality and following alone -- as long as the general market trend is positive. The chart is there simply to tell you when to buy. |
Has been a technical analyst since 1969, and has worked as a futures and options trader with First Financial Futures in Johannesburg, South Africa.
| Address: | 3256 West 24th Ave |
| Vancouver, BC | |
| Phone # for sales: | 6042634214 |
| E-mail address: | petroosp@gmail.com |
Click here for more information about our publications!
Comments
Date: 04/20/05Rank: 3Comment:
Date: 04/23/05Rank: 5Comment:

Request Information From Our Sponsors
- StockCharts.com, Inc.
- Candle Patterns
- Candlestick Charting Explained
- Intermarket Technical Analysis
- John Murphy on Chart Analysis
- John Murphy's Chart Pattern Recognition
- John Murphy's Market Message
- MurphyExplainsMarketAnalysis-Intermarket Analysis
- MurphyExplainsMarketAnalysis-Visual Analysis
- StockCharts.com
- Technical Analysis of the Financial Markets
- The Visual Investor
- VectorVest, Inc.
- Executive Premier Workshop
- One-Day Options Course
- OptionsPro
- Retirement Income Workshop
- Sure-Fire Trading Systems (VectorVest, Inc.)
- Trading as a Business Workshop
- VectorVest 7 EOD
- VectorVest 7 RealTime/IntraDay
- VectorVest AutoTester
- VectorVest Educational Services
- VectorVest OnLine
- VectorVest Options Analyzer
- VectorVest ProGraphics v6.0
- VectorVest ProTrader 7
- VectorVest RealTime Derby Tool
- VectorVest Simulator
- VectorVest Variator
- VectorVest Watchdog
