HOT TOPICS LIST
- MACD
- Fibonacci
- RSI
- Gann
- ADXR
- Stochastics
- Volume
- Triangles
- Futures
- Cycles
- Volatility
- ZIGZAG
- MESA
- Retracement
- Aroon
INDICATORS LIST
LIST OF TOPICS
PRINT THIS ARTICLE
by David Penn
A pair of positive stochastic divergences suggests, at minimum, a bounce for commodities--broadly speaking.
Position: N/A
David Penn
Technical Writer for Technical Analysis of STOCKS & COMMODITIES magazine, Working-Money.com, and Traders.com Advantage.
PRINT THIS ARTICLE
MA CROSS
Will Commodities Get A Bid?
04/20/05 07:37:12 AMby David Penn
A pair of positive stochastic divergences suggests, at minimum, a bounce for commodities--broadly speaking.
Position: N/A
| That the futures for the CRB index topped in March--along with stocks--should serve as still yet another response to those who do not believe that reflation is at the heart of financial asset recovery. And while a number of generally astute observers have suggested that a significant bottom is just around the corner in stocks (especially technology stocks), the technical evidence for a bounce might actually be more abundant in the commodities market. |
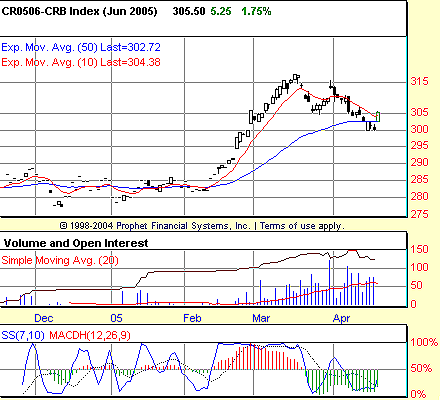
| I say that looking at Figure 1, a chart of the June CRB index futures contract. The March top in the CRB was anticipated by a 7,10 stochastic divergence from mid-February to mid-March. After falling roughly eight points, the June CRB dipped below its 10-day exponential moving average (EMA), but remained above its 50-day. Unfortunately for the bulls, the ensuing rally did not reach a new high. It is the decline since that second peak that has brought the CRB below its 50-day EMA as of mid-April. |

|
| Figure 1: CRB. Exploding to the upside in mid-February, the June CRB index contract topped in mid-March. Yet a positive stochastic divergence between the March and April lows suggests that the downside is likely to be limited in the immediate term. |
| Graphic provided by: Prophet Financial, Inc. |
| |
| The technical picture of commodities is interesting. First, note the fact that consecutively lower lows in price from March to April were matched by consecutively higher lows in the 7,10 stochastic. While that doesn't necessarily mean "rally," it does suggest that the correction lows might already be in with the April lows near 300. What is interesting about the divergence here is that it is really two divergences: one between the March and April lows, and another between the two, shorter-term lows in April. |
| Second, the depth of the moving average convergence/divergence histogram (MACDH) trough in March and April suggests a great deal of strength on the part of the bears. As I've written about MACDH troughs ("Post-Breakdown MACDH Extremes," Working Money, May 19, 2004), these troughs often suggest further lower price ahead. But these lower prices usually come after some countertrend movement--in the present case, that countertrend movement would be sideways to up. |
| Putting both of these pieces together suggests that commodities are likely to bounce higher in the coming days or weeks. Unfortunately for commodity bulls, however, it appears that this bounce might merely be the prelude to a resumption of the decline begun in mid-March. |
Technical Writer for Technical Analysis of STOCKS & COMMODITIES magazine, Working-Money.com, and Traders.com Advantage.
| Title: | Technical Writer |
| Company: | Technical Analysis, Inc. |
| Address: | 4757 California Avenue SW |
| Seattle, WA 98116 | |
| Phone # for sales: | 206 938 0570 |
| Fax: | 206 938 1307 |
| Website: | www.Traders.com |
| E-mail address: | DPenn@traders.com |
Traders' Resource Links | |
| Charting the Stock Market: The Wyckoff Method -- Books | |
| Working-Money.com -- Online Trading Services | |
| Traders.com Advantage -- Online Trading Services | |
| Technical Analysis of Stocks & Commodities -- Publications and Newsletters | |
| Working Money, at Working-Money.com -- Publications and Newsletters | |
| Traders.com Advantage -- Publications and Newsletters | |
| Professional Traders Starter Kit -- Software | |
Click here for more information about our publications!
Comments
Date: 04/20/05Rank: 3Comment:

Request Information From Our Sponsors
- StockCharts.com, Inc.
- Candle Patterns
- Candlestick Charting Explained
- Intermarket Technical Analysis
- John Murphy on Chart Analysis
- John Murphy's Chart Pattern Recognition
- John Murphy's Market Message
- MurphyExplainsMarketAnalysis-Intermarket Analysis
- MurphyExplainsMarketAnalysis-Visual Analysis
- StockCharts.com
- Technical Analysis of the Financial Markets
- The Visual Investor
- VectorVest, Inc.
- Executive Premier Workshop
- One-Day Options Course
- OptionsPro
- Retirement Income Workshop
- Sure-Fire Trading Systems (VectorVest, Inc.)
- Trading as a Business Workshop
- VectorVest 7 EOD
- VectorVest 7 RealTime/IntraDay
- VectorVest AutoTester
- VectorVest Educational Services
- VectorVest OnLine
- VectorVest Options Analyzer
- VectorVest ProGraphics v6.0
- VectorVest ProTrader 7
- VectorVest RealTime Derby Tool
- VectorVest Simulator
- VectorVest Variator
- VectorVest Watchdog
