

HOT TOPICS LIST
- MACD
- Fibonacci
- RSI
- Gann
- ADXR
- Stochastics
- Volume
- Triangles
- Futures
- Cycles
- Volatility
- ZIGZAG
- MESA
- Retracement
- Aroon
INDICATORS LIST
LIST OF TOPICS
PRINT THIS ARTICLE
by Arthur Hill
The S&P 100 broke key support last week, but the decline over the last two months could still turn out to be a normal correction.
Position: Accumulate
Arthur Hill
Arthur Hill is currently editor of TDTrader.com, a website specializing in trading strategies, sector/industry specific breadth stats and overall technical analysis. He passed the Society of Technical Analysts (STA London) diploma exam with distinction is a Certified Financial Technician (CFTe). Prior to TD Trader, he was the Chief Technical Analyst for Stockcharts.com and the main contributor to the ChartSchool.
PRINT THIS ARTICLE
RETRACEMENT
OEX Is Down, But Not Out Just Yet
04/19/05 09:11:51 AMby Arthur Hill
The S&P 100 broke key support last week, but the decline over the last two months could still turn out to be a normal correction.
Position: Accumulate
| Markets rarely move in a straight line. More likely, markets work their way in one direction or another (trend). An uptrend is characterized by higher highs and higher lows. The higher lows form after a pullback or correction reverses above the prior low. When this string of higher highs and higher lows ends, the trend changes from up to down. |
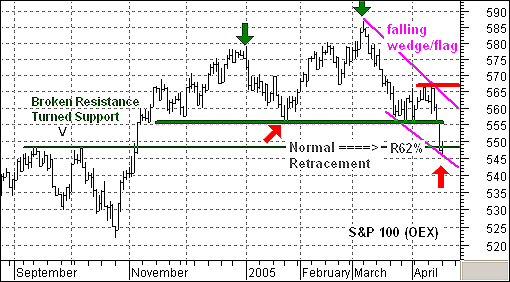
| Looking at the OEX price chart (Figure 1), we can see a resistance breakout in November, a higher high in December, and a higher high in March (green arrows). There was a higher low in January and then a lower low in April (red arrows). The lower low is clearly negative. However, with the combination of a higher high in early March AND a lower low in mid-April, a definitive trend change has yet to occur. |
|
| Figure 1: OEX. Looking at the OEX price chart, we can see a resistance breakout in November, a higher high in December, and a higher high in March (green arrows). There was a higher low in January and then a lower low in April (red arrows). |
| Graphic provided by: MetaStock. |
| Graphic provided by: Reuters Data. |
| |
| Despite the lower low and support break at 555, the current decline could still be viewed as a classic correction. First, the decline retraced 62% of the prior advance. Second, the decline returned to broken resistance around 448. Third, the decline looks like a falling wedge or price channel. |
| All these analysis points are classic for corrections. Buying at current levels would be a bottom-picking exercise and it would take a move above 567 to break the upper trendline and key resistance. Such a move would call for a continuation of the October-December advance and project new highs. |
Arthur Hill is currently editor of TDTrader.com, a website specializing in trading strategies, sector/industry specific breadth stats and overall technical analysis. He passed the Society of Technical Analysts (STA London) diploma exam with distinction is a Certified Financial Technician (CFTe). Prior to TD Trader, he was the Chief Technical Analyst for Stockcharts.com and the main contributor to the ChartSchool.
| Title: | Editor |
| Company: | TDTrader.com |
| Address: | Willem Geetsstraat 17 |
| Mechelen, B2800 | |
| Phone # for sales: | 3215345465 |
| Website: | www.tdtrader.com |
| E-mail address: | arthurh@tdtrader.com |
Traders' Resource Links | |
| TDTrader.com has not added any product or service information to TRADERS' RESOURCE. | |
Click here for more information about our publications!
Comments
Date:�04/20/05Rank:�4Comment:�
Date:�04/20/05Rank:�4Comment:�

Request Information From Our Sponsors
- StockCharts.com, Inc.
- Candle Patterns
- Candlestick Charting Explained
- Intermarket Technical Analysis
- John Murphy on Chart Analysis
- John Murphy's Chart Pattern Recognition
- John Murphy's Market Message
- MurphyExplainsMarketAnalysis-Intermarket Analysis
- MurphyExplainsMarketAnalysis-Visual Analysis
- StockCharts.com
- Technical Analysis of the Financial Markets
- The Visual Investor
- VectorVest, Inc.
- Executive Premier Workshop
- One-Day Options Course
- OptionsPro
- Retirement Income Workshop
- Sure-Fire Trading Systems (VectorVest, Inc.)
- Trading as a Business Workshop
- VectorVest 7 EOD
- VectorVest 7 RealTime/IntraDay
- VectorVest AutoTester
- VectorVest Educational Services
- VectorVest OnLine
- VectorVest Options Analyzer
- VectorVest ProGraphics v6.0
- VectorVest ProTrader 7
- VectorVest RealTime Derby Tool
- VectorVest Simulator
- VectorVest Variator
- VectorVest Watchdog