HOT TOPICS LIST
- MACD
- Fibonacci
- RSI
- Gann
- ADXR
- Stochastics
- Volume
- Triangles
- Futures
- Cycles
- Volatility
- ZIGZAG
- MESA
- Retracement
- Aroon
INDICATORS LIST
LIST OF TOPICS
PRINT THIS ARTICLE
by David Penn
A temporary respite in long rates flows from a head and shoulders top.
Position: N/A
David Penn
Technical Writer for Technical Analysis of STOCKS & COMMODITIES magazine, Working-Money.com, and Traders.com Advantage.
PRINT THIS ARTICLE
HEAD & SHOULDERS
The 10-Year Treasury Note's Head And Shoulders Top
04/19/05 07:52:10 AMby David Penn
A temporary respite in long rates flows from a head and shoulders top.
Position: N/A
| Given my difficulties in dealing with the Standard & Poor's 500's "pseudotruncated" top in March ("The Count Right Now, Redux," Working Money, April 20-22) and the all-too-temporary low in mid-April ("Another Low, Another Punk Divergence," Traders.com Advantage, April 4, 2005), it is refreshing to have found more fertile analytic ground in crude oil ("Crude's 2B Top Comes To the Dailies," Traders.com Advantage, April 5, 2005), and the dollar ("The Dollar's March Divergence," Traders.com Advantage, March 15, 2005). |
| Another place where this analysis has been razor sharp has been in the bond market--particularly yields on the 10-year note. In late March, I suggested that these yields, tracked by the $TNX index, had topped temporarily ("The 10-Year Note's Temporary Top," March 25, 2005, Traders.com Advantage). In fact, if you look at the article, you'll note that the figure provided is an excellent screen capture of the precise top on March 23, taken intraday. |

|
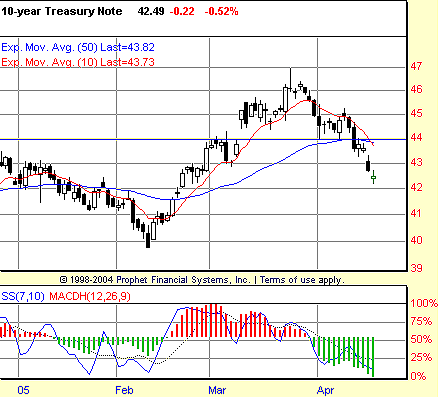
| Figure 1: An island gap, a head and shoulders top, a negative stochastic divergence ... all signs are bearish as yields on the 10-year Treasury note move into April. |
| Graphic provided by: Prophet Financial, Inc. |
| |
| That was then. In the days since, $TNX has fallen from an intraday high near $47 (or 4.7% on the 10-year) to just north of $42.50 by mid-April. While it was difficult--if not impossible--to anticipate how far down the correction might go back when I first wrote about the $TNX topping, that task is now easier, given the development of a island top in the form of a head and shoulders pattern (Figure 1). The island gap is formed when prices gap into a consolidation and then gap away from it. Island tops occur when markets gap up into consolidations and then gap down back against the previous trend--and that certainly appears to be what has happened in the case of $TNX in April. |
| What is interesting about this island gap is that it has formed a head and shoulders top during its consolidation. This head and shoulders top has a neckline at about $44 (the low point of the gap up from early March) and a high of $47, suggesting a minimum downside of three points to the $41 level before the correction will have run its course. |
| Should $TNX fall to this level, then observers will no doubt anticipate a test of the February lows just south of $40. With the 7,10 stochastic moving toward a new low for April, the likelihood of $TNX finding a bottom before testing the $41-40 level is not especially great. |
Technical Writer for Technical Analysis of STOCKS & COMMODITIES magazine, Working-Money.com, and Traders.com Advantage.
| Title: | Technical Writer |
| Company: | Technical Analysis, Inc. |
| Address: | 4757 California Avenue SW |
| Seattle, WA 98116 | |
| Phone # for sales: | 206 938 0570 |
| Fax: | 206 938 1307 |
| Website: | www.Traders.com |
| E-mail address: | DPenn@traders.com |
Traders' Resource Links | |
| Charting the Stock Market: The Wyckoff Method -- Books | |
| Working-Money.com -- Online Trading Services | |
| Traders.com Advantage -- Online Trading Services | |
| Technical Analysis of Stocks & Commodities -- Publications and Newsletters | |
| Working Money, at Working-Money.com -- Publications and Newsletters | |
| Traders.com Advantage -- Publications and Newsletters | |
| Professional Traders Starter Kit -- Software | |
Click here for more information about our publications!
Comments
Date: 04/20/05Rank: 3Comment:
Date: 04/20/05Rank: 3Comment:

Request Information From Our Sponsors
- StockCharts.com, Inc.
- Candle Patterns
- Candlestick Charting Explained
- Intermarket Technical Analysis
- John Murphy on Chart Analysis
- John Murphy's Chart Pattern Recognition
- John Murphy's Market Message
- MurphyExplainsMarketAnalysis-Intermarket Analysis
- MurphyExplainsMarketAnalysis-Visual Analysis
- StockCharts.com
- Technical Analysis of the Financial Markets
- The Visual Investor
- VectorVest, Inc.
- Executive Premier Workshop
- One-Day Options Course
- OptionsPro
- Retirement Income Workshop
- Sure-Fire Trading Systems (VectorVest, Inc.)
- Trading as a Business Workshop
- VectorVest 7 EOD
- VectorVest 7 RealTime/IntraDay
- VectorVest AutoTester
- VectorVest Educational Services
- VectorVest OnLine
- VectorVest Options Analyzer
- VectorVest ProGraphics v6.0
- VectorVest ProTrader 7
- VectorVest RealTime Derby Tool
- VectorVest Simulator
- VectorVest Variator
- VectorVest Watchdog
