HOT TOPICS LIST
- MACD
- Fibonacci
- RSI
- Gann
- ADXR
- Stochastics
- Volume
- Triangles
- Futures
- Cycles
- Volatility
- ZIGZAG
- MESA
- Retracement
- Aroon
INDICATORS LIST
LIST OF TOPICS
PRINT THIS ARTICLE
by David Penn
A classic reversal pattern anticipates weakness and a test of the lows.
Position: N/A
David Penn
Technical Writer for Technical Analysis of STOCKS & COMMODITIES magazine, Working-Money.com, and Traders.com Advantage.
PRINT THIS ARTICLE
REVERSAL
An Intraday Emini 2B Top
04/18/05 11:53:53 AMby David Penn
A classic reversal pattern anticipates weakness and a test of the lows.
Position: N/A
| In describing the trading behind the 2B top setup, trader Victor Sperandeo highlights the behavior of trading floor "locals," whose knowledge of where traders and investors tend to put their stops--mental or physical--plays a key role in creating an advantageous trading opportunity. |
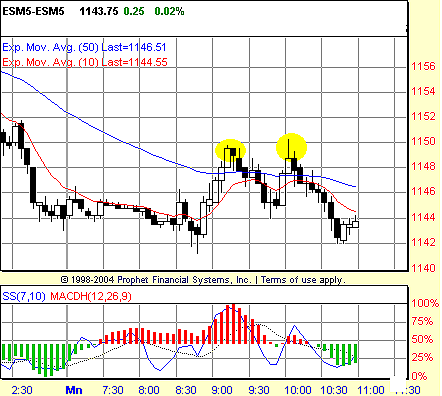
| "Aware of these stop points, the locals as well as the brokers who trade on their own account have a vested interest in driving prices slightly above or below those 'resistance' or 'support' points to force execution of the stop-loss orders. This is called 'taking out the stops.' After the stops are executed, the market will readjust. This is exactly what happens in the case of most 2Bs and is typical action in all markets." The trading this morning in the June emini S&P is an excellent example of this trading pattern in action. Figure 1 shows the ESM5 in five-minute increments. |

|
| Figure 1: A positive stochastic divergence in the 8 o'clock hour is followed by a 2B top and negative stochastic divergence in the 9 o'clock hour. |
| Graphic provided by: Prophet Financial, Inc. |
| |
| The ESM5 rallied on Monday morning, reaching a high of 1149 %BE between 9:10 and 9:15 am (Eastern). A relatively normal pullback ensued, but the lows from which the rally emerged earlier in the day held, providing a generally bullish outlook for the day. The market bounced from the 1144 level and went on to make a higher high of 1150 %BC between 10:00 and 10:05 am (Eastern). However, there were a number of bearish aspects to this new high. First, even though there was a new high, that new high was not accompanied by a higher close vis-a-vis the 9:10-9:15 am close. In fact, there is an argument that a shooting star top formed with the 10:00-10:05 am high. |
| Second, the higher high is accompanied by a negative stochastic divergence. Note how the 7,10 stochastic forms a lower low at 10:00-10:15 am, at the same time that the ESM5 is forming a higher high. This does not necessarily negate the positive stochastic divergence in the 8 o'clock hour. But it does suggest more sideways-to-down movement is likely, rather than steadily higher prices. The third bearish factor was the 2B top. When the market made a higher high, yet was unable to show followthrough to the upside and, instead, fell below the low of the previous high, then the classic 2B top sequence is complete and a reversal of some sort is likely to follow. That was certainly the case Monday morning, as ESM5 fell back below the 1147-1148 level. This level was the low of the previous high and the sell point for the 2B top. It also is the sell area for those using the method of trading divergences that I wrote about for Working Money ("Confirming Divergences," December 22, 2004). |
| Even the moving average convergence/divergence histogram (MACDH) methodology I've often written about would have turned a profit here. I've generally found the MACDH methodology often less effective with the emini at the five-minute level. But here, a sell point at about 1146 would have been created by the MACDH reversal and turning down of the stochastic accompanying the 10:10-10:15 am bar. Most intraday traders would have likely been able to net a few points in the 10 o'clock hour as the ESM5 continued lower. |
Technical Writer for Technical Analysis of STOCKS & COMMODITIES magazine, Working-Money.com, and Traders.com Advantage.
| Title: | Technical Writer |
| Company: | Technical Analysis, Inc. |
| Address: | 4757 California Avenue SW |
| Seattle, WA 98116 | |
| Phone # for sales: | 206 938 0570 |
| Fax: | 206 938 1307 |
| Website: | www.Traders.com |
| E-mail address: | DPenn@traders.com |
Traders' Resource Links | |
| Charting the Stock Market: The Wyckoff Method -- Books | |
| Working-Money.com -- Online Trading Services | |
| Traders.com Advantage -- Online Trading Services | |
| Technical Analysis of Stocks & Commodities -- Publications and Newsletters | |
| Working Money, at Working-Money.com -- Publications and Newsletters | |
| Traders.com Advantage -- Publications and Newsletters | |
| Professional Traders Starter Kit -- Software | |
Click here for more information about our publications!
Comments
Date: 04/20/05Rank: 3Comment:

Request Information From Our Sponsors
- StockCharts.com, Inc.
- Candle Patterns
- Candlestick Charting Explained
- Intermarket Technical Analysis
- John Murphy on Chart Analysis
- John Murphy's Chart Pattern Recognition
- John Murphy's Market Message
- MurphyExplainsMarketAnalysis-Intermarket Analysis
- MurphyExplainsMarketAnalysis-Visual Analysis
- StockCharts.com
- Technical Analysis of the Financial Markets
- The Visual Investor
- VectorVest, Inc.
- Executive Premier Workshop
- One-Day Options Course
- OptionsPro
- Retirement Income Workshop
- Sure-Fire Trading Systems (VectorVest, Inc.)
- Trading as a Business Workshop
- VectorVest 7 EOD
- VectorVest 7 RealTime/IntraDay
- VectorVest AutoTester
- VectorVest Educational Services
- VectorVest OnLine
- VectorVest Options Analyzer
- VectorVest ProGraphics v6.0
- VectorVest ProTrader 7
- VectorVest RealTime Derby Tool
- VectorVest Simulator
- VectorVest Variator
- VectorVest Watchdog
