HOT TOPICS LIST
- MACD
- Fibonacci
- RSI
- Gann
- ADXR
- Stochastics
- Volume
- Triangles
- Futures
- Cycles
- Volatility
- ZIGZAG
- MESA
- Retracement
- Aroon
INDICATORS LIST
LIST OF TOPICS
PRINT THIS ARTICLE
by Arthur Hill
The Nikkei 225 failed at neckline resistance and upside momentum continues to wane.
Position: Sell
Arthur Hill
Arthur Hill is currently editor of TDTrader.com, a website specializing in trading strategies, sector/industry specific breadth stats and overall technical analysis. He passed the Society of Technical Analysts (STA London) diploma exam with distinction is a Certified Financial Technician (CFTe). Prior to TD Trader, he was the Chief Technical Analyst for Stockcharts.com and the main contributor to the ChartSchool.
PRINT THIS ARTICLE
MACD
Nikkei Fails A Major Resistance
04/18/05 09:13:22 AMby Arthur Hill
The Nikkei 225 failed at neckline resistance and upside momentum continues to wane.
Position: Sell
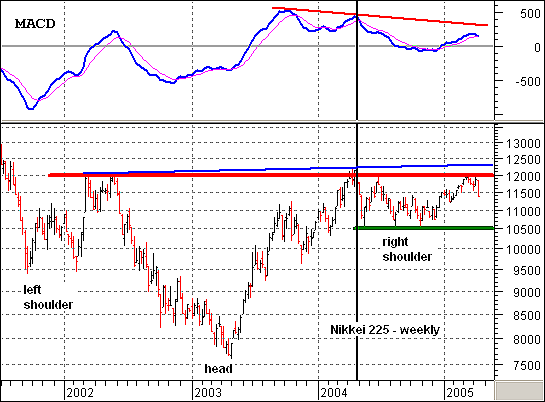
| First, let's look at this massive inverted head-and-shoulders. The low of the left shoulder formed around 9500 at the end of 2002 and the low of the head formed in May 2003. The lows of the right shoulder formed around 10500 in the latter part of 2004. Technically, the neckline slopes up and extends to around 12800. However, I elected to mark key resistance at 12000 as the index failed at this level in July 2004, March 2005 and April 2005. Obviously, a move above 12000 would forge a major breakout and further strength above 12500 would leave no doubt about the future path of the Nikkei. |
| However, waning momentum is taking its toll. The weekly moving average convergence/divergence (MACD) peaked in October 2003 and has been drifting lower ever since. The indicator formed a lower high in April 2004, and this coincided with a higher high in the index (black line). The result is a negative divergence and the first warning sign for the bulls. The index moved back toward 12000 recently, but the pace was relatively slow, and subsequently, MACD formed another lower high. Last week, the indicator moved below its signal line and it would not take much to turn MACD negative (fully bearish). |

|
| Figure 1: Nikkei. The index remains in a trading range with support at 10500 and resistance at 12000. A definitive long-term outlook will not emerge until this range is broken -- above 12000 bullish and below 10500 bearish. |
| Graphic provided by: MetaStock. |
| Graphic provided by: Reuters Data. |
| |
| Turning back to Figure 1, the index remains in a trading range with support at 10500 and resistance at 12000. A definitive long-term outlook will not emerge until this range is broken -- above 12000 bullish and below 10500 bearish. Given the recent failure at 12000 and waning momentum, the odds favor a support test at 10500. This in turn increases the odds of a support break, and the bulk of the evidence currently favors the bears. |
Arthur Hill is currently editor of TDTrader.com, a website specializing in trading strategies, sector/industry specific breadth stats and overall technical analysis. He passed the Society of Technical Analysts (STA London) diploma exam with distinction is a Certified Financial Technician (CFTe). Prior to TD Trader, he was the Chief Technical Analyst for Stockcharts.com and the main contributor to the ChartSchool.
| Title: | Editor |
| Company: | TDTrader.com |
| Address: | Willem Geetsstraat 17 |
| Mechelen, B2800 | |
| Phone # for sales: | 3215345465 |
| Website: | www.tdtrader.com |
| E-mail address: | arthurh@tdtrader.com |
Traders' Resource Links | |
| TDTrader.com has not added any product or service information to TRADERS' RESOURCE. | |
Click here for more information about our publications!
Comments
Date: 04/19/05Rank: 5Comment: I loved the article,how is the best way to make money from this information ? Any inverse funds to the nikkei 225 that I could use in an IRA ?
Date: 04/20/05Rank: 3Comment:
Date: 04/20/05Rank: 4Comment:

Request Information From Our Sponsors
- StockCharts.com, Inc.
- Candle Patterns
- Candlestick Charting Explained
- Intermarket Technical Analysis
- John Murphy on Chart Analysis
- John Murphy's Chart Pattern Recognition
- John Murphy's Market Message
- MurphyExplainsMarketAnalysis-Intermarket Analysis
- MurphyExplainsMarketAnalysis-Visual Analysis
- StockCharts.com
- Technical Analysis of the Financial Markets
- The Visual Investor
- VectorVest, Inc.
- Executive Premier Workshop
- One-Day Options Course
- OptionsPro
- Retirement Income Workshop
- Sure-Fire Trading Systems (VectorVest, Inc.)
- Trading as a Business Workshop
- VectorVest 7 EOD
- VectorVest 7 RealTime/IntraDay
- VectorVest AutoTester
- VectorVest Educational Services
- VectorVest OnLine
- VectorVest Options Analyzer
- VectorVest ProGraphics v6.0
- VectorVest ProTrader 7
- VectorVest RealTime Derby Tool
- VectorVest Simulator
- VectorVest Variator
- VectorVest Watchdog
