HOT TOPICS LIST
- MACD
- Fibonacci
- RSI
- Gann
- ADXR
- Stochastics
- Volume
- Triangles
- Futures
- Cycles
- Volatility
- ZIGZAG
- MESA
- Retracement
- Aroon
INDICATORS LIST
LIST OF TOPICS
PRINT THIS ARTICLE
by Koos van der Merwe
Gambling is a profession or an addiction, whether at a casino in Las Vegas or in Vancouver, BC, in Canada, where casinos are proliferating.
Position: Accumulate
Koos van der Merwe
Has been a technical analyst since 1969, and has worked as a futures and options trader with First Financial Futures in Johannesburg, South Africa.
PRINT THIS ARTICLE
ELLIOTT WAVE
Las Vegas From Home
04/15/05 08:47:45 AMby Koos van der Merwe
Gambling is a profession or an addiction, whether at a casino in Las Vegas or in Vancouver, BC, in Canada, where casinos are proliferating.
Position: Accumulate
| Today, gambling is becoming an addiction/profession on the Internet, where you can even play poker with professionals and learn from your mistakes--costly, but doesn't all university education come at a price? The question is, of course, should owning the stock of an Internet gambling company be considered to be gambling or a sound investment? One of the many companies that has shown itself as a sound investment is called Las Vegas at Home, trading on the Vancouver Stock Exchange. |

|
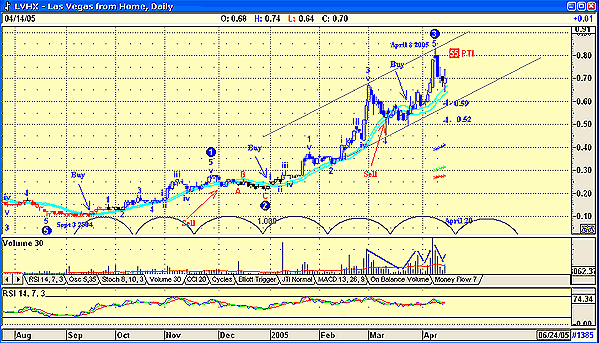
| Figure 1: Las Vegas at Home. Are gambling stocks a gamble or a sound investment? |
| Graphic provided by: AdvancedGET. |
| |
| The share price was C$0.10 on September 3, 2004, and has slowly climbed to reach a high of C$0.80 by April 8, 2005. Figure 1 shows an Elliott wave count, suggesting that the present correction is a wave 4 with a possible low of C$0.59 or C$0.54. The chart is also suggesting a rise in a major impulse fifth-wave move to C$0.98 (not shown on the chart) with a 54% probability of achieving this count. Both the wave count and the PTI count shown are part of the AdvancedGET program. Will the share price reach this high? The financial statements of the company still show a loss, with little or no improvement over the previous year, so the rise in the price could be a "gamble" with a certain amount of risk, but unlike a casino, where the odds are in favor of the casino, in the market, using technical and fundamental analysis, the odds are in your favor. |
| At the moment the trend is down, but do note the following: a. The stock price rises on a rising volume, and falls on a reducing volume. This is very bullish. b. The relative strength index seems to be moving sideways rather than rising above the 70 parameter, and then falling below it, triggering a sell signal. c. The JM internal band is a 15-period simple moving average offset by 2% positive and 2% negative. I have shown buy and sell signals on the chart. A break above the upper line is a buy signal, and a fall below the lower band line a sell signal. Once again, the price has fallen to test the band and seems to have bounced off it, suggesting that you could accumulate the share. d. Finally, the cycle seems to show a bottom on April 20. |
| A stock to watch, and possibly own. |
Has been a technical analyst since 1969, and has worked as a futures and options trader with First Financial Futures in Johannesburg, South Africa.
| Address: | 3256 West 24th Ave |
| Vancouver, BC | |
| Phone # for sales: | 6042634214 |
| E-mail address: | petroosp@gmail.com |
Click here for more information about our publications!
Comments
Date: 04/15/05Rank: 3Comment:

|

Request Information From Our Sponsors
- StockCharts.com, Inc.
- Candle Patterns
- Candlestick Charting Explained
- Intermarket Technical Analysis
- John Murphy on Chart Analysis
- John Murphy's Chart Pattern Recognition
- John Murphy's Market Message
- MurphyExplainsMarketAnalysis-Intermarket Analysis
- MurphyExplainsMarketAnalysis-Visual Analysis
- StockCharts.com
- Technical Analysis of the Financial Markets
- The Visual Investor
- VectorVest, Inc.
- Executive Premier Workshop
- One-Day Options Course
- OptionsPro
- Retirement Income Workshop
- Sure-Fire Trading Systems (VectorVest, Inc.)
- Trading as a Business Workshop
- VectorVest 7 EOD
- VectorVest 7 RealTime/IntraDay
- VectorVest AutoTester
- VectorVest Educational Services
- VectorVest OnLine
- VectorVest Options Analyzer
- VectorVest ProGraphics v6.0
- VectorVest ProTrader 7
- VectorVest RealTime Derby Tool
- VectorVest Simulator
- VectorVest Variator
- VectorVest Watchdog
