HOT TOPICS LIST
- MACD
- Fibonacci
- RSI
- Gann
- ADXR
- Stochastics
- Volume
- Triangles
- Futures
- Cycles
- Volatility
- ZIGZAG
- MESA
- Retracement
- Aroon
INDICATORS LIST
LIST OF TOPICS
PRINT THIS ARTICLE
by Han Kim
Using a combination of indicators can help in confirming buy and sell signals.
Position: N/A
Han Kim
Traders.com Advantage Staff Writer
PRINT THIS ARTICLE
STRATEGIES
Using Multiple Indicators
06/22/00 11:12:50 AMby Han Kim
Using a combination of indicators can help in confirming buy and sell signals.
Position: N/A
| Most technical analysts use more than one indicator to confirm their buy and sell signals. Given the number of indicators available, it can be a chore to select an effective combination. I have found the following three indicators to work well together: 1) the 2-line moving average crossover 2) the relative strength indicator (RSI) 3) the horizontal support and resistance line This combination is in line with my trading strategy which is to find securities with short-term growth potential, determine if it is oversold/overbought and its upside/downside potential. Here's how each indicator works:
|
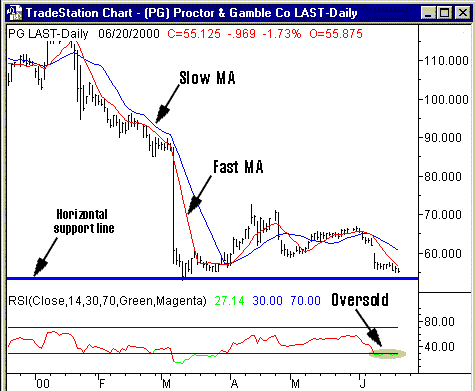
| I am going to apply my three indicators to Proctor & Gamble Co. (PG). First, I check the RSI to see if it's oversold or overbought. It's currently at 27.28, under the 30 level which indicates an oversold condition. |

|
| Proctor & Gamble Co. (PG) is oversold, but it may be bottoming out. |
| Graphic provided by: TradeStation. |
| |
| Next, I check the support and resistance levels. The horizontal support seems to be right around 54. The horizontal support line gives me and idea of how low the price might go before it starts to go up. |
| Finally, I want to get in when the security shows a positive trend. The 2-line moving average crossover helps in determining this. Right now the fast moving average is below the slow moving average which generates a sell signal. I will have to wait till the faster one crosses above the slower one and if at the time the other indicators signal a buy I'll place my order. To protect myself from losses I would set a stop order slightly below the horizontal support line. Since the price is currently at 55, I'm risking a little over 1.8%. You could try to get in at a lower price to reduce the risk level but the price may not get to your level. The risk can be calculated like this: SOP = Stop Order Price CP = Current Price Risk % = (1 - (SOP / CP)) * 100 |
Traders.com Advantage Staff Writer
| Title: | Webmaster |
| Company: | Technical Analysis, Inc. |
| Address: | 4757 California AVE SW |
| Seattle, WA 98116 | |
| Phone # for sales: | 206-938-0570 |
| Fax: | 206-938-1307 |
| Website: | www.traders.com |
| E-mail address: | hkim@traders.com |
Traders' Resource Links | |
| Charting the Stock Market: The Wyckoff Method -- Books | |
| Working-Money.com -- Online Trading Services | |
| Traders.com Advantage -- Online Trading Services | |
| Technical Analysis of Stocks & Commodities -- Publications and Newsletters | |
| Working Money, at Working-Money.com -- Publications and Newsletters | |
| Traders.com Advantage -- Publications and Newsletters | |
| Professional Traders Starter Kit -- Software | |
Click here for more information about our publications!
Comments
Date: / /Rank: Comment: would be great to see more on elliot wave, gann fans, fibb. techniques, etc....
Date: / /Rank: 4Comment: Have ben using multiple indicators
for 30 years. RSI is OK, but RS is much better.
Date: / /Rank: 5Comment: Thank you for the insightful article.
How do you determine which type of weighting to utilize with the short and long term moving average (ie.,regular,exponential,time weighted, varriable weighted,triangular weighting etc.??)
Also, how do you determine the best periods to utilize with the short and long term moving averages (ie,9/14.,14/28.,etc).
Your insight on this would be greatly appreciated
Date: / /Rank: Comment: The buy and sell signal generates from 2 lines moving average crossover comes late and sometimes gives a false signal. That way we have to consider to use others indicators, such as Bollinger Bands or others envelope.

|

Request Information From Our Sponsors
- VectorVest, Inc.
- Executive Premier Workshop
- One-Day Options Course
- OptionsPro
- Retirement Income Workshop
- Sure-Fire Trading Systems (VectorVest, Inc.)
- Trading as a Business Workshop
- VectorVest 7 EOD
- VectorVest 7 RealTime/IntraDay
- VectorVest AutoTester
- VectorVest Educational Services
- VectorVest OnLine
- VectorVest Options Analyzer
- VectorVest ProGraphics v6.0
- VectorVest ProTrader 7
- VectorVest RealTime Derby Tool
- VectorVest Simulator
- VectorVest Variator
- VectorVest Watchdog
- StockCharts.com, Inc.
- Candle Patterns
- Candlestick Charting Explained
- Intermarket Technical Analysis
- John Murphy on Chart Analysis
- John Murphy's Chart Pattern Recognition
- John Murphy's Market Message
- MurphyExplainsMarketAnalysis-Intermarket Analysis
- MurphyExplainsMarketAnalysis-Visual Analysis
- StockCharts.com
- Technical Analysis of the Financial Markets
- The Visual Investor
