

HOT TOPICS LIST
- MACD
- Fibonacci
- RSI
- Gann
- ADXR
- Stochastics
- Volume
- Triangles
- Futures
- Cycles
- Volatility
- ZIGZAG
- MESA
- Retracement
- Aroon
INDICATORS LIST
LIST OF TOPICS
PRINT THIS ARTICLE
by Kevin Hopson
One area of key support has already been taken out. Can Dell hold the next line?
Position: N/A
Kevin Hopson
Kevin has been a technical analyst for roughly 10 years now. Previously, Kevin owned his own business and acted as a registered investment advisor, specializing in energy. He was also a freelance oil analyst for Orient Trading Co., a commodity futures trading firm in Japan. Kevin is currently a freelance writer.
PRINT THIS ARTICLE
TECHNICAL ANALYSIS
Dell Testing Another Layer Of Support
04/15/05 08:14:07 AMby Kevin Hopson
One area of key support has already been taken out. Can Dell hold the next line?
Position: N/A
| Dell Inc. (DELL) has been in a clear downtrend since January 2005, as illustrated by the one-year chart (Figure 1). More specifically, note how prices have been contained within the black pitchfork the past three months. Even though the stock breached the top parallel line of the pitchfork on a couple of occasions, prices failed to overcome the sliding parallel line (or purple warning line). Had Dell broken above this downtrend line, the stock would have given a buy signal and prices would have likely rallied. |
| Unfortunately, it didn't happen. Instead, prices proceeded to break key support in the $37.60 to $38.00 range. This was the site of last November's unfilled gap (green circle), the 50% retracement level ($37.66) from the August 2004 to December 2004 rally, the sliding red parallel line and the top parallel line of the blue pitchfork. When the stock broke support here earlier this month, it paved the way for an ensuing selloff, which leads us to the current situation. |
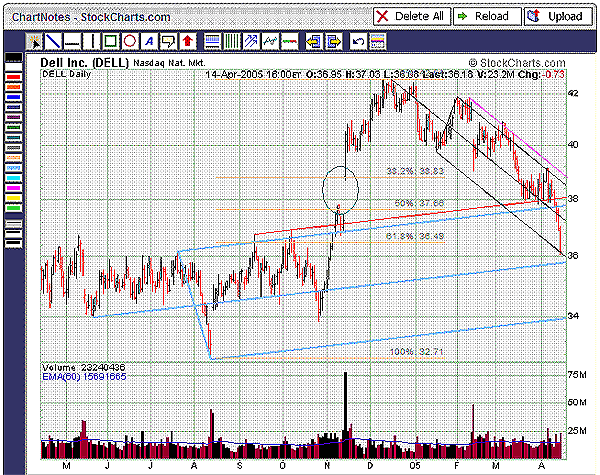
|
| Figure 1: Dell one-year chart. Dell stock has been in a clear downtrend since January 2005, as illustrated by the one-year chart. |
| Graphic provided by: StockCharts.com. |
| |
| As you can see, Dell is testing the bottom parallel line of the black pitchfork ($36.00) right now. In addition, the blue median line ($35.80) comes into play just below this level. As a result, Dell needs to hold support in the $35.80 to $36.00 range, or the stock could see another wave of selling pressure in the near term. More specifically, prices could eventually make their way down to the $34.00 level, which is the site of last October's low and the bottom parallel line of the blue pitchfork. |
Kevin has been a technical analyst for roughly 10 years now. Previously, Kevin owned his own business and acted as a registered investment advisor, specializing in energy. He was also a freelance oil analyst for Orient Trading Co., a commodity futures trading firm in Japan. Kevin is currently a freelance writer.
| Glen Allen, VA | |
| E-mail address: | hopson_1@yahoo.com |
Click here for more information about our publications!
Comments
Date:�04/15/05Rank:�3Comment:�

Request Information From Our Sponsors
- VectorVest, Inc.
- Executive Premier Workshop
- One-Day Options Course
- OptionsPro
- Retirement Income Workshop
- Sure-Fire Trading Systems (VectorVest, Inc.)
- Trading as a Business Workshop
- VectorVest 7 EOD
- VectorVest 7 RealTime/IntraDay
- VectorVest AutoTester
- VectorVest Educational Services
- VectorVest OnLine
- VectorVest Options Analyzer
- VectorVest ProGraphics v6.0
- VectorVest ProTrader 7
- VectorVest RealTime Derby Tool
- VectorVest Simulator
- VectorVest Variator
- VectorVest Watchdog
- StockCharts.com, Inc.
- Candle Patterns
- Candlestick Charting Explained
- Intermarket Technical Analysis
- John Murphy on Chart Analysis
- John Murphy's Chart Pattern Recognition
- John Murphy's Market Message
- MurphyExplainsMarketAnalysis-Intermarket Analysis
- MurphyExplainsMarketAnalysis-Visual Analysis
- StockCharts.com
- Technical Analysis of the Financial Markets
- The Visual Investor