HOT TOPICS LIST
- MACD
- Fibonacci
- RSI
- Gann
- ADXR
- Stochastics
- Volume
- Triangles
- Futures
- Cycles
- Volatility
- ZIGZAG
- MESA
- Retracement
- Aroon
INDICATORS LIST
LIST OF TOPICS
PRINT THIS ARTICLE
by Paolo Pezzutti
The study of relationships between range and volume provides a valuable insight to market conditions.
Position: N/A
Paolo Pezzutti
Author of the book "Trading the US Markets - A Comprehensive Guide to US Markets for International Traders and Investors" - Harriman House (July 2008)
PRINT THIS ARTICLE
TECHNICAL ANALYSIS
CME Euro FX Continuous Contract: Is The Trend Over?
04/18/05 11:05:31 AMby Paolo Pezzutti
The study of relationships between range and volume provides a valuable insight to market conditions.
Position: N/A
| I suggest using the market facilitation index with which to analyze the CME euro FX continuous contract. It is defined as the ratio range/volume. This indicator provides you with the ability to determine the efficiency with which prices are changing and the market's willingness to move prices. According to trader Bill Williams, comparing changes of the previous bar's value of this index to changes in volume, it is possible to determine the interest that the market has in the current price trend. Four possible combinations occur: Green: Index up, volume up. The public is participating in the market. The market is fast and directional. It provides support to the trend and expectations for higher/lower prices. Fade: Index down, volume down. The market activity is slowing down with little insight of who is in power between buyers and sellers. Fake: Index up, volume down. There are no new participants in the market. Breakouts and moves into resistance/support levels are to be examined, but cautiously. Squat: Index Down, Volume Up. The volume is increasing, but the price is not moving as strongly in the same direction. At turning points, reversals can generate significant moves in the opposite direction. These combinations can be used in all time frames. |
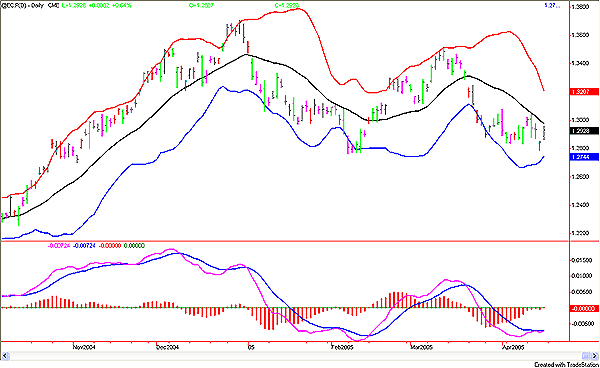
 Figure 1: CME Euro FX Continuous Contract, Daily. In Figure 1, you can see that prices tested the upper Bollinger Band in February and with a divergence of the moving average convergence/divergence (MACD) in March. Here, two high-volume bars did not support a further price advance. Following to that, a green bar indicated the way ahead for prices: down. Two fade bars gave some breadth to the market and provided a good short entry point. From that point on, prices moved down quickly with an impulse, and they are now consolidating at the 1.29 level. The Bollinger Bands are still opening, indicating an ongoing impulse. |

|
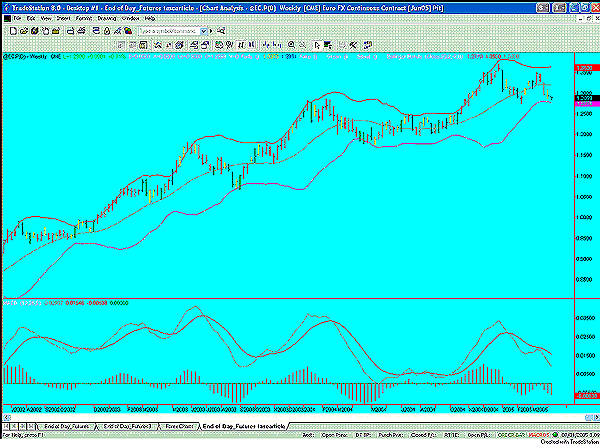
| Figure 2: CME Euro FX Continuous Contract, Weekly |
| Graphic provided by: TradeStation. |
| |
| In Figure 2, the higher time frame once again displays (at the resistance levels in December 2004 and March 2005) two high-volume bars with small range. This is a contraction pattern that has a good reversal potential. MACD tested its moving average and then gave a sell signal. The breakout brought prices to the lower Bollinger Band with a fade bar. At that point, prices must test the February low (which is also a squat bar). So far, the Bollinger Bands do not indicate an increase in volatility. |
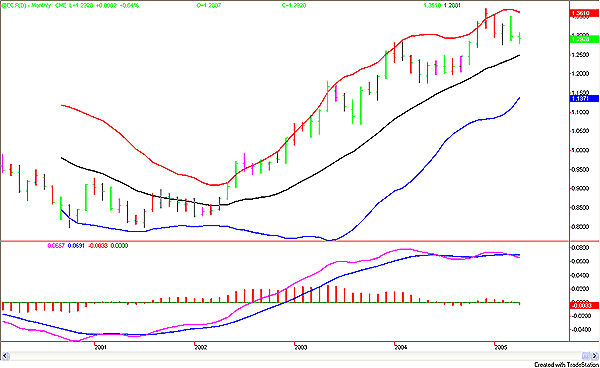
 Figure 3: CME Euro FX Continuous Contract, Monthly. Resistance at the end of 2004 and beginning of 2005 also in this time frame was met by squat bars. The following movement in March displays a green bar, indicating sell pressure to reach at least support levels. The MACD is still at its highs, but there is no momentum and Bollinger Bands are closing. |
| As a final consideration, putting all pieces together: - In the long term, prices are still in an uptrend but showing a consolidation pattern. - In the medium term, prices are testing their support levels. - In the short term, indications are for lower prices. It is too early to say if the breakout tentative on the daily chart will be successful. However, looking at the longer time frames, we can assume that the uptrend for the moment is over. A test of support at 1.25 and a trading range with resistance at 1.34 are the most likely scenario for the coming weeks. |
Author of the book "Trading the US Markets - A Comprehensive Guide to US Markets for International Traders and Investors" - Harriman House (July 2008)
| Address: | VIA ROBERTO AGO 26 POSTAL CODE 00166 |
| Rome, ITALY | |
| Phone # for sales: | +393357540708 |
| E-mail address: | pezzutti.paolo@tiscali.it |
Click here for more information about our publications!
Comments
Date: 04/18/05Rank: 5Comment:
Date: 04/20/05Rank: 4Comment:
Date: 04/20/05Rank: 4Comment:
Date: 04/20/05Rank: 3Comment:

Request Information From Our Sponsors
- StockCharts.com, Inc.
- Candle Patterns
- Candlestick Charting Explained
- Intermarket Technical Analysis
- John Murphy on Chart Analysis
- John Murphy's Chart Pattern Recognition
- John Murphy's Market Message
- MurphyExplainsMarketAnalysis-Intermarket Analysis
- MurphyExplainsMarketAnalysis-Visual Analysis
- StockCharts.com
- Technical Analysis of the Financial Markets
- The Visual Investor
- VectorVest, Inc.
- Executive Premier Workshop
- One-Day Options Course
- OptionsPro
- Retirement Income Workshop
- Sure-Fire Trading Systems (VectorVest, Inc.)
- Trading as a Business Workshop
- VectorVest 7 EOD
- VectorVest 7 RealTime/IntraDay
- VectorVest AutoTester
- VectorVest Educational Services
- VectorVest OnLine
- VectorVest Options Analyzer
- VectorVest ProGraphics v6.0
- VectorVest ProTrader 7
- VectorVest RealTime Derby Tool
- VectorVest Simulator
- VectorVest Variator
- VectorVest Watchdog
