HOT TOPICS LIST
- MACD
- Fibonacci
- RSI
- Gann
- ADXR
- Stochastics
- Volume
- Triangles
- Futures
- Cycles
- Volatility
- ZIGZAG
- MESA
- Retracement
- Aroon
INDICATORS LIST
LIST OF TOPICS
PRINT THIS ARTICLE
by Arthur Hill
With help from Alcoa, the Dow Jones Aluminum Index forged an island reversal. However, it is not quite enough to negate larger bearish patterns just yet.
Position: Accumulate
Arthur Hill
Arthur Hill is currently editor of TDTrader.com, a website specializing in trading strategies, sector/industry specific breadth stats and overall technical analysis. He passed the Society of Technical Analysts (STA London) diploma exam with distinction is a Certified Financial Technician (CFTe). Prior to TD Trader, he was the Chief Technical Analyst for Stockcharts.com and the main contributor to the ChartSchool.
PRINT THIS ARTICLE
ISLAND REVERSAL
DJ Aluminum Index Forms Island Reversal
04/13/05 07:59:39 AMby Arthur Hill
With help from Alcoa, the Dow Jones Aluminum Index forged an island reversal. However, it is not quite enough to negate larger bearish patterns just yet.
Position: Accumulate
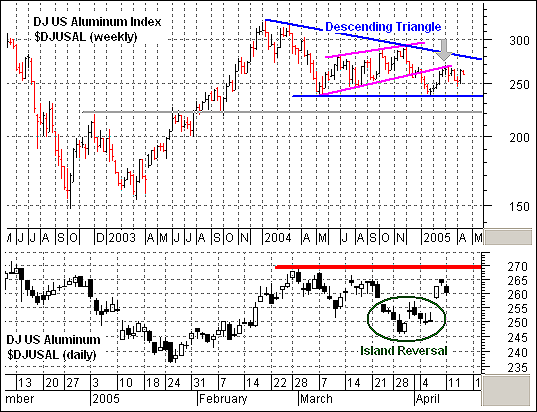
| First, let's look at the weekly chart for a big picture overview (Figure 1). The pattern since January 2004 looks like a large descending triangle. The highs are lower as buyers lack the resolve required to forge a breakout and the lows are equal. This is a bearish pattern and a move below the pattern lows would signal further weakness. |
| Within the descending triangle, we can see a sharp decline followed by a rising price channel and trendline break (magenta trendlines). There was a bounce after the trendline break and the trendline extension turned into resistance (gray arrow). With the lower lows and trendline break, the descending triangle (blue trendlines) and rising price channel (magenta trendlines) give the index a clear bearish bias. |

|
| Figure 1: Dow Jones Aluminum Index. A look at the weekly chart for a big picture overview shows the pattern since January 2004 looks like a large descending triangle. |
| Graphic provided by: MetaStock. |
| Graphic provided by: Reuters Data. |
| |
| A glance at the daily chart (not seen here) shows the island reversal. The index gapped down in late March and gapped up in early April. In fact, this is the second gap up in as many weeks and the index shows sudden buying pressure. However, I am not easily impressed and would prefer to see the index move above early March high (269). The gray arrow on the weekly chart points to this high as well. Such a move would show followthrough on the island reversal and take out an even more important resistance level on the weekly chart. |
Arthur Hill is currently editor of TDTrader.com, a website specializing in trading strategies, sector/industry specific breadth stats and overall technical analysis. He passed the Society of Technical Analysts (STA London) diploma exam with distinction is a Certified Financial Technician (CFTe). Prior to TD Trader, he was the Chief Technical Analyst for Stockcharts.com and the main contributor to the ChartSchool.
| Title: | Editor |
| Company: | TDTrader.com |
| Address: | Willem Geetsstraat 17 |
| Mechelen, B2800 | |
| Phone # for sales: | 3215345465 |
| Website: | www.tdtrader.com |
| E-mail address: | arthurh@tdtrader.com |
Traders' Resource Links | |
| TDTrader.com has not added any product or service information to TRADERS' RESOURCE. | |
Click here for more information about our publications!
Comments
Date: 04/13/05Rank: 3Comment:
Date: 04/14/05Rank: 3Comment:

|

Request Information From Our Sponsors
- StockCharts.com, Inc.
- Candle Patterns
- Candlestick Charting Explained
- Intermarket Technical Analysis
- John Murphy on Chart Analysis
- John Murphy's Chart Pattern Recognition
- John Murphy's Market Message
- MurphyExplainsMarketAnalysis-Intermarket Analysis
- MurphyExplainsMarketAnalysis-Visual Analysis
- StockCharts.com
- Technical Analysis of the Financial Markets
- The Visual Investor
- VectorVest, Inc.
- Executive Premier Workshop
- One-Day Options Course
- OptionsPro
- Retirement Income Workshop
- Sure-Fire Trading Systems (VectorVest, Inc.)
- Trading as a Business Workshop
- VectorVest 7 EOD
- VectorVest 7 RealTime/IntraDay
- VectorVest AutoTester
- VectorVest Educational Services
- VectorVest OnLine
- VectorVest Options Analyzer
- VectorVest ProGraphics v6.0
- VectorVest ProTrader 7
- VectorVest RealTime Derby Tool
- VectorVest Simulator
- VectorVest Variator
- VectorVest Watchdog
