HOT TOPICS LIST
- MACD
- Fibonacci
- RSI
- Gann
- ADXR
- Stochastics
- Volume
- Triangles
- Futures
- Cycles
- Volatility
- ZIGZAG
- MESA
- Retracement
- Aroon
INDICATORS LIST
LIST OF TOPICS
PRINT THIS ARTICLE
by David Penn
The wide-range bar on April 1 was the first tipoff that this pattern might develop. But are there any clues about the direction any break from this diamond will travel?
Position: N/A
David Penn
Technical Writer for Technical Analysis of STOCKS & COMMODITIES magazine, Working-Money.com, and Traders.com Advantage.
PRINT THIS ARTICLE
THE DIAMOND
The Diamond's Diamond
04/13/05 09:21:57 AMby David Penn
The wide-range bar on April 1 was the first tipoff that this pattern might develop. But are there any clues about the direction any break from this diamond will travel?
Position: N/A
| I've been watching the bottoming process in the Dow diamonds for the past few days, ever since I began to suspect that an expanding triangle in late March was really just the first half of a diamond consolidation. True, I've been seeing more diamonds in price charts than might be found on the fingers of some SIN CITY crime lord. But the fact of the matter is that a diamond (like a triangle, rectangle, or cup with handle) is just another word for a consolidation you can use. |
| So why not see what kinds of uses the DIA diamond pattern that has developed over the past month might have? |

|
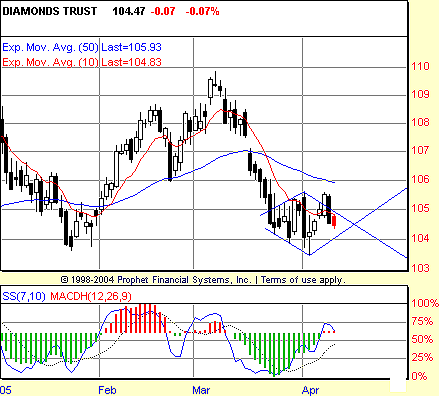
| Figure 1: Rising stochastic troughs as March gives way to April could help set up higher prices in the DIA, which is struggling to resolve a diamond breakout. |
| Graphic provided by: Prophet Financial, Inc. |
| |
| If your ears are still ringing from all the gong-banging I've been doing about the combination of chart patterns and technical indicators over the past several weeks (if not months), then you might want to skip the rest of this article because I'm pulling out my gong-striker once again. Here, the 7,10 stochastic is tentatively suggesting a positive divergence. The pair of stochastic lows in late March were close to providing this kind of divergence. But to my eye, that divergence never materialized, as the stochastic troughs were, at best, equal and, at worst, consecutively lower. |
| That is clearly not the case, however, with the next set of stochastic troughs. Comparing the low point in the stochastic in March (which corresponds to the price low in March) with the stochastic trough that appears very early in April (which corresponds to the price low in April, which is lower than the price low in March) suggests that the positive divergence is a reality as of April 7, when the buy-side entry target of 105.50 (established on the previous day) was triggered. A reality, yes--but a rather cruel one, as prices reversed sharply on April 8, taking out the previous two days' lows. This reversal would have knocked out many players speculating lightly on the March/April lows--particularly as prices for the DIA moved lower on Monday, April 11. |
| Nevertheless, those who have their aims somewhat lower (as in the March or April lows) remain still in the game. And nothing has happened to dispel the bullishness of the positive divergence--namely, a violation of the March/April lows. If and until that moment comes, the bulls might be down (heck, they might be way down), but they are clearly far from out. |
Technical Writer for Technical Analysis of STOCKS & COMMODITIES magazine, Working-Money.com, and Traders.com Advantage.
| Title: | Technical Writer |
| Company: | Technical Analysis, Inc. |
| Address: | 4757 California Avenue SW |
| Seattle, WA 98116 | |
| Phone # for sales: | 206 938 0570 |
| Fax: | 206 938 1307 |
| Website: | www.Traders.com |
| E-mail address: | DPenn@traders.com |
Traders' Resource Links | |
| Charting the Stock Market: The Wyckoff Method -- Books | |
| Working-Money.com -- Online Trading Services | |
| Traders.com Advantage -- Online Trading Services | |
| Technical Analysis of Stocks & Commodities -- Publications and Newsletters | |
| Working Money, at Working-Money.com -- Publications and Newsletters | |
| Traders.com Advantage -- Publications and Newsletters | |
| Professional Traders Starter Kit -- Software | |
Click here for more information about our publications!
Comments
Date: 04/13/05Rank: 3Comment:
Date: 04/14/05Rank: 5Comment:

Request Information From Our Sponsors
- StockCharts.com, Inc.
- Candle Patterns
- Candlestick Charting Explained
- Intermarket Technical Analysis
- John Murphy on Chart Analysis
- John Murphy's Chart Pattern Recognition
- John Murphy's Market Message
- MurphyExplainsMarketAnalysis-Intermarket Analysis
- MurphyExplainsMarketAnalysis-Visual Analysis
- StockCharts.com
- Technical Analysis of the Financial Markets
- The Visual Investor
- VectorVest, Inc.
- Executive Premier Workshop
- One-Day Options Course
- OptionsPro
- Retirement Income Workshop
- Sure-Fire Trading Systems (VectorVest, Inc.)
- Trading as a Business Workshop
- VectorVest 7 EOD
- VectorVest 7 RealTime/IntraDay
- VectorVest AutoTester
- VectorVest Educational Services
- VectorVest OnLine
- VectorVest Options Analyzer
- VectorVest ProGraphics v6.0
- VectorVest ProTrader 7
- VectorVest RealTime Derby Tool
- VectorVest Simulator
- VectorVest Variator
- VectorVest Watchdog
