HOT TOPICS LIST
- MACD
- Fibonacci
- RSI
- Gann
- ADXR
- Stochastics
- Volume
- Triangles
- Futures
- Cycles
- Volatility
- ZIGZAG
- MESA
- Retracement
- Aroon
INDICATORS LIST
LIST OF TOPICS
PRINT THIS ARTICLE
by Kevin Hopson
A three-month trading range is still intact for General Electric.
Position: N/A
Kevin Hopson
Kevin has been a technical analyst for roughly 10 years now. Previously, Kevin owned his own business and acted as a registered investment advisor, specializing in energy. He was also a freelance oil analyst for Orient Trading Co., a commodity futures trading firm in Japan. Kevin is currently a freelance writer.
PRINT THIS ARTICLE
TECHNICAL ANALYSIS
General Electric Is Range Bound
04/11/05 07:44:19 AMby Kevin Hopson
A three-month trading range is still intact for General Electric.
Position: N/A
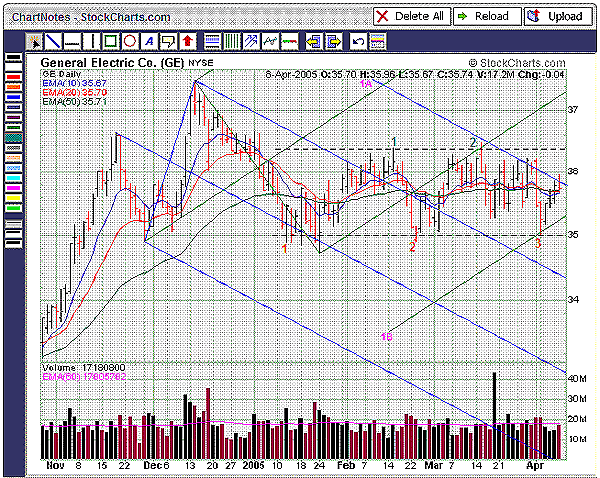
| Since the beginning of the year, General Electric (GE) has been stuck in a trading range between $35.00 and $36.40, as illustrated by the dotted black lines in Figure 1. Despite the sideways action during the past three months, there have been some key developments for the stock. For example, note how the bottom parallel line of the green pitchfork has been acting as resistance for GE since the stock breached this uptrend line in late February. In addition, the 1A channel line (top blue line) and February's high (top of the trading range) recently converged here, strengthening resistance at the $36.40 level. |
| Since reversing here, GE has continued to find resistance along the 1A channel line. On the other hand, the 1B channel line (bottom green line) recently acted as support for the stock. With these two trendlines converging, something will have to give soon. More specifically, a break of the 1A channel line will likely lead to an upside test of the trading range, while a break of the 1B channel line will likely lead to a downside test of the trading range. |

|
| Figure 1: General Electric. Since the beginning of the year, General Electric (GE) has been stuck in a trading range between $35.00 and $36.40, as illustrated here. Despite the sideways action during the past three months, there have been some key developments for the stock. |
| Graphic provided by: StockCharts.com. |
| |
| Though it is uncertain which way the stock will break, there are a couple of indicators that point to lower prices. For example, trading ranges tend to act as continuation patterns. Because General Electric was pulling back prior to the formation of this trading range, pattern analysis predicts a break to the downside. In addition, prices often break in the direction of the fifth trading range test. More specifically, if you count the number of times that prices tested the top and bottom channel lines in alternate sequence, you will see that the fifth test (#3) occurred along the bottom channel line. However, the best thing to do is to wait for an official breakout. Even though this will reduce profit potential, there should be plenty of time to get in at the early stage of the move. |
| If GE moves below the $35.00 level, prices could eventually make their way down to the $30.80 to $32.20 range. I calculated this target by taking the number of times that prices have tested the bottom channel line in alternate sequence (3), multiplying this by the width of the trading range ($36.40-$35.00=$1.40) and then subtracting this figure ($1.40x3=$4.20) from the top ($36.40-$4.20=$32.20) and bottom ($35.00-$4.20=$30.80) channel lines. This price range assumes that the top channel line will not be tested again before breaking down. |
| On the other hand, if General Electric moves above the $36.40 level, prices could eventually make their way up to the $39.20 to $40.60 range. Because prices would have to test the top channel line a third time for an upside breakout to occur, the numbers used to calculate this target range are the same as before. The only difference is that you would add $4.20 to the top and bottom channel lines, as opposed to subtracting this number. In any event, keep a close eye on the stock, as a trading opportunity will eventually present itself. |
Kevin has been a technical analyst for roughly 10 years now. Previously, Kevin owned his own business and acted as a registered investment advisor, specializing in energy. He was also a freelance oil analyst for Orient Trading Co., a commodity futures trading firm in Japan. Kevin is currently a freelance writer.
| Glen Allen, VA | |
| E-mail address: | hopson_1@yahoo.com |
Click here for more information about our publications!
Comments
Date: 04/11/05Rank: 3Comment:

Request Information From Our Sponsors
- StockCharts.com, Inc.
- Candle Patterns
- Candlestick Charting Explained
- Intermarket Technical Analysis
- John Murphy on Chart Analysis
- John Murphy's Chart Pattern Recognition
- John Murphy's Market Message
- MurphyExplainsMarketAnalysis-Intermarket Analysis
- MurphyExplainsMarketAnalysis-Visual Analysis
- StockCharts.com
- Technical Analysis of the Financial Markets
- The Visual Investor
- VectorVest, Inc.
- Executive Premier Workshop
- One-Day Options Course
- OptionsPro
- Retirement Income Workshop
- Sure-Fire Trading Systems (VectorVest, Inc.)
- Trading as a Business Workshop
- VectorVest 7 EOD
- VectorVest 7 RealTime/IntraDay
- VectorVest AutoTester
- VectorVest Educational Services
- VectorVest OnLine
- VectorVest Options Analyzer
- VectorVest ProGraphics v6.0
- VectorVest ProTrader 7
- VectorVest RealTime Derby Tool
- VectorVest Simulator
- VectorVest Variator
- VectorVest Watchdog
