HOT TOPICS LIST
- MACD
- Fibonacci
- RSI
- Gann
- ADXR
- Stochastics
- Volume
- Triangles
- Futures
- Cycles
- Volatility
- ZIGZAG
- MESA
- Retracement
- Aroon
INDICATORS LIST
LIST OF TOPICS
PRINT THIS ARTICLE
by David Penn
Will a diamond pattern in June gold anticipate a reversal of fortune for partisans of the yellow metal?
Position: N/A
David Penn
Technical Writer for Technical Analysis of STOCKS & COMMODITIES magazine, Working-Money.com, and Traders.com Advantage.
PRINT THIS ARTICLE
REVERSAL
A Golden Bounce
04/11/05 07:38:23 AMby David Penn
Will a diamond pattern in June gold anticipate a reversal of fortune for partisans of the yellow metal?
Position: N/A
| Just how much panic should gold bulls be in these days? On the one hand, gold bulls--whose ranks have swelled to nearly historic proportions in the years since the gold market bottomed in 2001--have merely seen the yellow metal slip from a late 2004 high just north of $460 to an early April 2005 low just south of $430 (basis June futures). No pleasure cruise, to be sure. But a far cry from the sort of beating that gold bulls endured on a regular basis over the two decades since the 1980 peak. |
| At times it seems, though, that you'd be hard pressed to convince the buggiest of gold bugs of this fact. Looking at the chart of gold futures, or the index of unhedged gold stocks known as the $HUI, the gold bull sees a relentless decline from late November to early February, a relief rally that lasts until mid-March, and then a resumption of the decline--a resumption that retraced half of the relief rally in less than a month. |

|
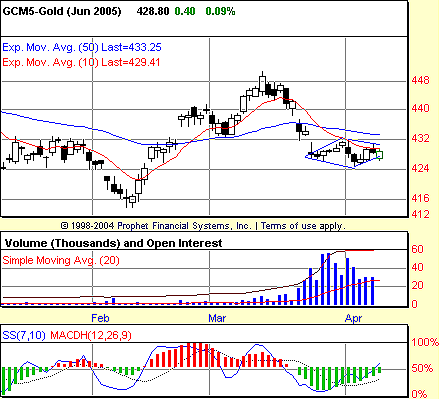
| Figure 1: Gold. The positive stochastic divergence between the March lows and the April lows in June gold suggests the possibility of strength in these futures going forward. |
| Graphic provided by: Prophet Financial, Inc. |
| |
| For many (myself included), the fact that the $HUI's bounce in February and into March did not retrace more than 61.8% (on a closing basis) of the previous decline only contributed to the bearishness of the outlook for gold. Gold futures, however, did reach the 61.8% mark (falling short at 78.6%). At worst, then, there was some measure of divergence between the gold stocks and the underlying. And at best, there was a chance that the relative weakness in the $HUI--the negative side of that divergence--might become strength as gold futures, which retraced more of their previous decline, moved higher again. |
| There seems to be an opportunity in April for gold futures to do just that. The technical road for an advance in gold is paved with a positive stochastic divergence and a diamond consolidation pattern. Neither the divergence nor the diamond are pristine; the higher low of the stochastic divergence arrives as the indicator is racing higher, threatening to become oversold only a few days after suggesting a bullish reversal (or, at least, no immediate new lows) ... But having successfully caught a positive stochastic divergence with a diamond combo in the intraday Standard & Poor's 500 recently (see my "Diamonds And Divergences," Traders.com Advantage, April 5), I'm finding it hard to ignore the bullish possibilities of the current divergence/diamond combo in June gold. |
| Again, the positive stochastic divergence is between the consecutively lower lows in June gold in late March and early April, and the consecutively higher lows in the 7,10 stochastic. The fact that June gold's price action during this period was contained in a diamond consolidation suggests that accumulation might be going on as this divergence develops and, eventually, manifests itself in an upside breakout for gold. The diamond pattern, it should be noted, is not huge, measuring about $8 from highest point to lowest point. A successful breakout from the diamond (from, say, roughly the middle of the pattern at $428) then could be expected to take June gold as high as $436 in an initial move. This would provide gold with an opportunity, at a minimum, to close some of the gaps that developed during the declines in the second half of March. |
Technical Writer for Technical Analysis of STOCKS & COMMODITIES magazine, Working-Money.com, and Traders.com Advantage.
| Title: | Technical Writer |
| Company: | Technical Analysis, Inc. |
| Address: | 4757 California Avenue SW |
| Seattle, WA 98116 | |
| Phone # for sales: | 206 938 0570 |
| Fax: | 206 938 1307 |
| Website: | www.Traders.com |
| E-mail address: | DPenn@traders.com |
Traders' Resource Links | |
| Charting the Stock Market: The Wyckoff Method -- Books | |
| Working-Money.com -- Online Trading Services | |
| Traders.com Advantage -- Online Trading Services | |
| Technical Analysis of Stocks & Commodities -- Publications and Newsletters | |
| Working Money, at Working-Money.com -- Publications and Newsletters | |
| Traders.com Advantage -- Publications and Newsletters | |
| Professional Traders Starter Kit -- Software | |
Click here for more information about our publications!
Comments
Date: 04/11/05Rank: 3Comment:
Date: 04/12/05Rank: 5Comment:

Request Information From Our Sponsors
- StockCharts.com, Inc.
- Candle Patterns
- Candlestick Charting Explained
- Intermarket Technical Analysis
- John Murphy on Chart Analysis
- John Murphy's Chart Pattern Recognition
- John Murphy's Market Message
- MurphyExplainsMarketAnalysis-Intermarket Analysis
- MurphyExplainsMarketAnalysis-Visual Analysis
- StockCharts.com
- Technical Analysis of the Financial Markets
- The Visual Investor
- VectorVest, Inc.
- Executive Premier Workshop
- One-Day Options Course
- OptionsPro
- Retirement Income Workshop
- Sure-Fire Trading Systems (VectorVest, Inc.)
- Trading as a Business Workshop
- VectorVest 7 EOD
- VectorVest 7 RealTime/IntraDay
- VectorVest AutoTester
- VectorVest Educational Services
- VectorVest OnLine
- VectorVest Options Analyzer
- VectorVest ProGraphics v6.0
- VectorVest ProTrader 7
- VectorVest RealTime Derby Tool
- VectorVest Simulator
- VectorVest Variator
- VectorVest Watchdog
