HOT TOPICS LIST
- MACD
- Fibonacci
- RSI
- Gann
- ADXR
- Stochastics
- Volume
- Triangles
- Futures
- Cycles
- Volatility
- ZIGZAG
- MESA
- Retracement
- Aroon
INDICATORS LIST
LIST OF TOPICS
PRINT THIS ARTICLE
by Koos van der Merwe
At the end of 2004, I wrote: "Hopefully, 2005 will follow tradition and be a very bullish year..."
Position: Accumulate
Koos van der Merwe
Has been a technical analyst since 1969, and has worked as a futures and options trader with First Financial Futures in Johannesburg, South Africa.
PRINT THIS ARTICLE
ELLIOTT WAVE
The Dow Revisited
04/08/05 09:43:43 AMby Koos van der Merwe
At the end of 2004, I wrote: "Hopefully, 2005 will follow tradition and be a very bullish year..."
Position: Accumulate
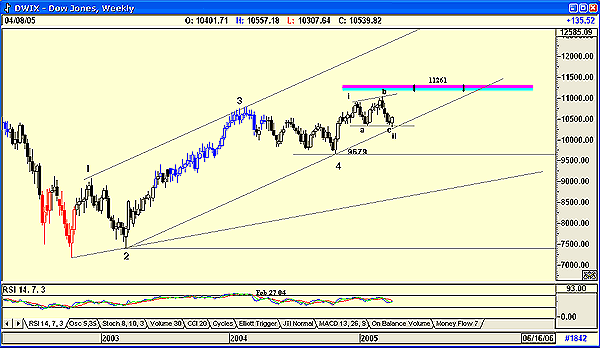
| On December 28, 2004, in "How High The Dow?" for Traders.com Advantage, I wrote: "Hopefully, 2005 will follow tradition and be a very bullish year..." The chart I offered then was a daily chart, and the chart I offer now is a weekly one (Figure 1), but the wave count is identical. Since December, the Dow Jones industrials has traced another leg in what I believe is wave ii of a five-wave impulse leg upward to complete wave 5. |
| In Figure 1, I have shown the following: a. The support line 2-4, which wave ii appears to have found. b. The resistance line 1-3, which is parallel to the support line, and verifies it. c. An open-ended triangle i-a-b-c-ii. This trumpet formation is usually unreliable, but the fact that it has a flat base, a double bottom, lends credence to a rise to test the MOB (make or break) line, the target determined from the high at 13. An MOB line is an indicator of AdvancedGET. The MOB study is an excellent tool that can help you find the target price area for the end of an Elliott wave 5, or for any pattern that has an impulse-correction-impulse pattern. d. Do note that the MOB target position at 11261 does not allow a true impulse Elliott wave count to be recorded, but a fifth wave FLAT. However, the MOB rules allow for a break above the MOB target area. Should this occur, then the index will rise to an equal distance above the MOB line as it rose to enter the MOB. At the start of wave 5, the value was 9679. To calculate: - 11261 - 9679 = 1582 + 11261 = 12843. This means that we could see the Dow rising to 12843 before a strong correction. e. Finally, the bee in the bonnet is of course the relative strength index (RSI), and I have arbitrarily chosen a 14-week RSI. The indicator gave a sell signal on February 27, 2004, and has been ineffectual since, although the RSI is suggesting a downtrend. This does hint that we could see the index move sideways in another abc pattern before a move up to finalize the fifth wave. Do remember that wave 2 was a simple wave, which means that wave 4 must be a complicated wave. |

|
| Figure 1: Dow week, wave count. Since December, the Dow Jones industrials has traced another leg in what may be a wave ii of a five-wave impulse leg upward to complete wave 5. |
| Graphic provided by: AdvancedGET. |
| |
| To conclude, the Dow could either be moving sideways, forming a strong base for a very strong move upward, possibly as high as 12843 to complete its fifth wave, or it could move into a fifth wave failure flat, that would target 11261. |
Has been a technical analyst since 1969, and has worked as a futures and options trader with First Financial Futures in Johannesburg, South Africa.
| Address: | 3256 West 24th Ave |
| Vancouver, BC | |
| Phone # for sales: | 6042634214 |
| E-mail address: | petroosp@gmail.com |
Click here for more information about our publications!
Comments
Date: 04/08/05Rank: 2Comment:
Date: 04/14/05Rank: 2Comment:

|

Request Information From Our Sponsors
- StockCharts.com, Inc.
- Candle Patterns
- Candlestick Charting Explained
- Intermarket Technical Analysis
- John Murphy on Chart Analysis
- John Murphy's Chart Pattern Recognition
- John Murphy's Market Message
- MurphyExplainsMarketAnalysis-Intermarket Analysis
- MurphyExplainsMarketAnalysis-Visual Analysis
- StockCharts.com
- Technical Analysis of the Financial Markets
- The Visual Investor
- VectorVest, Inc.
- Executive Premier Workshop
- One-Day Options Course
- OptionsPro
- Retirement Income Workshop
- Sure-Fire Trading Systems (VectorVest, Inc.)
- Trading as a Business Workshop
- VectorVest 7 EOD
- VectorVest 7 RealTime/IntraDay
- VectorVest AutoTester
- VectorVest Educational Services
- VectorVest OnLine
- VectorVest Options Analyzer
- VectorVest ProGraphics v6.0
- VectorVest ProTrader 7
- VectorVest RealTime Derby Tool
- VectorVest Simulator
- VectorVest Variator
- VectorVest Watchdog
