HOT TOPICS LIST
- MACD
- Fibonacci
- RSI
- Gann
- ADXR
- Stochastics
- Volume
- Triangles
- Futures
- Cycles
- Volatility
- ZIGZAG
- MESA
- Retracement
- Aroon
INDICATORS LIST
LIST OF TOPICS
PRINT THIS ARTICLE
by David Penn
A piercing pattern, a positive stochastic divergence ... could the much-loathed telecommunications stocks be among the first to move higher in April?
Position: N/A
David Penn
Technical Writer for Technical Analysis of STOCKS & COMMODITIES magazine, Working-Money.com, and Traders.com Advantage.
PRINT THIS ARTICLE
CANDLESTICK CHARTING
Telecom's Time To Shine?
04/07/05 11:25:14 AMby David Penn
A piercing pattern, a positive stochastic divergence ... could the much-loathed telecommunications stocks be among the first to move higher in April?
Position: N/A
| The last time I looked at telecommunications stocks, it was back in November 2004. But rather than looking at the sector as a whole, I was preoccupied with the fate of one stock, SBC Communications, and the consequences that a diamond consolidation might have for the share price ("Telecoms Top Out?" November 23, 2004). |
| For the record, I was bearish--and suggested that the next stop for SBC was $22.75, two and a half points lower than its $25.52 print at the time. Since late November, when that article was written, SBC shares have fallen as low as $23.50 in January and $23 in mid-March. |

|
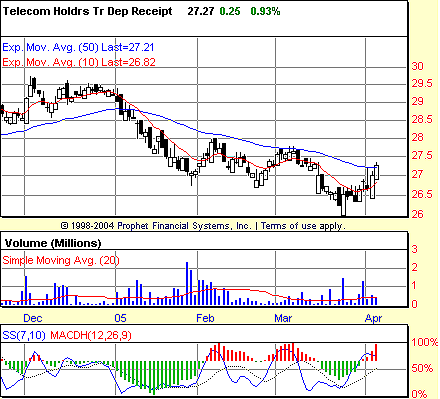
| Figure 1: Three the bullish way? A Japanese candlestick piercing pattern, a positive stochastic divergence, and big volume conspire to send the TTH higher in April. |
| Graphic provided by: Prophet Financial, Inc. |
| |
| Since mid-March, shares of SBC -- like the telecom group itself -- has seen better days, bouncing as high as $24.30 in recent trading. And looking at the group, using the proxy TTH, it is little surprise why. On March 23, TTH made a piercing pattern on strong volume. Coming in concert with a positive stochastic divergence in the 7,10 stochastic, this pattern suggested strongly that prices for TTH were headed higher in the near term. |
| The piercing pattern comes from Japanese candlestick analysis. Here's preeminent Japanese candlestick analyst Steve Nison explaining how the pattern works in his book, JAPANESE CANDLESTICK CHARTING TECHNIQUES: "The first candlestick is a black real body day and the second is a long, white real body day. This white day opens sharply lower, under the low of the prior black day. Then prices push higher, creating a relatively long, white real body that closes above the mid-point of the prior day's black real body. ... In the piercing pattern, the greater the degree of penetration into the black real body, the more likely it will be a bottom reversal. An ideal piercing pattern will have a white real body that pushes more than halfway into the prior session's black real body." Per Nison, then, the piercing pattern in TTH on March 23 is pretty close to ideal. There is some selling as prices tried to remain in the upper end of the day's range. But even that withstanding, the bullishness of March 23 is worthy of note. |
| And the fact that it comes on big volume and a positive divergence ain't no bag of salt, either. Those who have been longing for clear positive divergences in the case of the Standard & Poor's 500, for example (see my Traders.com Advantage article, "Another Low, Another Punk Divergence," April 4, 2005), need go no further than the one created by the TTH in late March. In fact, the piercing candlestick actually occurs on the very day of the "lower low in price/higher low in the stochastic" part of the positive divergence. And while I've never made high volume on this key bar/candlestick a priority, it can only be a bullish sign as it appears here. Immediate upside in the TTH will likely be tested by resistance between $27.5 and $28--to say nothing of the 50-day exponential moving average (EMA). If the TTH is able to "work off" any overbought condition brought on by the sudden move off the lows without making new lows, then the possibility of still higher prices in the telecom group will remain intact. |
Technical Writer for Technical Analysis of STOCKS & COMMODITIES magazine, Working-Money.com, and Traders.com Advantage.
| Title: | Technical Writer |
| Company: | Technical Analysis, Inc. |
| Address: | 4757 California Avenue SW |
| Seattle, WA 98116 | |
| Phone # for sales: | 206 938 0570 |
| Fax: | 206 938 1307 |
| Website: | www.Traders.com |
| E-mail address: | DPenn@traders.com |
Traders' Resource Links | |
| Charting the Stock Market: The Wyckoff Method -- Books | |
| Working-Money.com -- Online Trading Services | |
| Traders.com Advantage -- Online Trading Services | |
| Technical Analysis of Stocks & Commodities -- Publications and Newsletters | |
| Working Money, at Working-Money.com -- Publications and Newsletters | |
| Traders.com Advantage -- Publications and Newsletters | |
| Professional Traders Starter Kit -- Software | |
Click here for more information about our publications!
Comments
Date: 04/07/05Rank: 2Comment:

|

Request Information From Our Sponsors
- StockCharts.com, Inc.
- Candle Patterns
- Candlestick Charting Explained
- Intermarket Technical Analysis
- John Murphy on Chart Analysis
- John Murphy's Chart Pattern Recognition
- John Murphy's Market Message
- MurphyExplainsMarketAnalysis-Intermarket Analysis
- MurphyExplainsMarketAnalysis-Visual Analysis
- StockCharts.com
- Technical Analysis of the Financial Markets
- The Visual Investor
- VectorVest, Inc.
- Executive Premier Workshop
- One-Day Options Course
- OptionsPro
- Retirement Income Workshop
- Sure-Fire Trading Systems (VectorVest, Inc.)
- Trading as a Business Workshop
- VectorVest 7 EOD
- VectorVest 7 RealTime/IntraDay
- VectorVest AutoTester
- VectorVest Educational Services
- VectorVest OnLine
- VectorVest Options Analyzer
- VectorVest ProGraphics v6.0
- VectorVest ProTrader 7
- VectorVest RealTime Derby Tool
- VectorVest Simulator
- VectorVest Variator
- VectorVest Watchdog
