

HOT TOPICS LIST
- MACD
- Fibonacci
- RSI
- Gann
- ADXR
- Stochastics
- Volume
- Triangles
- Futures
- Cycles
- Volatility
- ZIGZAG
- MESA
- Retracement
- Aroon
INDICATORS LIST
LIST OF TOPICS
PRINT THIS ARTICLE
by Arthur Hill
Despite the decline over the last few weeks, the Dow Jones industrials remains in a clear uptrend on the P&F chart with support close at hand.
Position: Hold
Arthur Hill
Arthur Hill is currently editor of TDTrader.com, a website specializing in trading strategies, sector/industry specific breadth stats and overall technical analysis. He passed the Society of Technical Analysts (STA London) diploma exam with distinction is a Certified Financial Technician (CFTe). Prior to TD Trader, he was the Chief Technical Analyst for Stockcharts.com and the main contributor to the ChartSchool.
PRINT THIS ARTICLE
POINT & FIGURE
Dow Point & Figure Chart Still In Bull Mode
04/07/05 09:53:52 AMby Arthur Hill
Despite the decline over the last few weeks, the Dow Jones industrials remains in a clear uptrend on the P&F chart with support close at hand.
Position: Hold
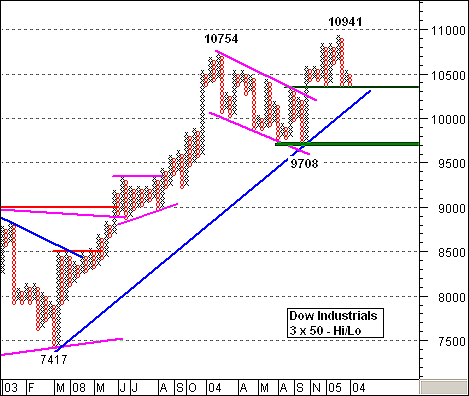
| Figure 1 is a 3 x 50 point & figure chart of the Dow Jones Industrial Average (DJIA). "Three" means that the three-box reversal method is used. "Fifty" is the number of points for each box (X or O). The high-low range is used for calculation, not the close. |
| Three things jump out at me. First, the DJIA is holding above the blue trendline extending up from the March 2003 low. This trendline sets the tone of the current advance, and it is difficult to rationalize a downtrend as long as this trendline holds. Second, the DJIA formed a large falling flag (10754 to 9708) and the November breakout (~10350) signaled a continuation higher. The falling flag is a classic bullish continuation pattern and there is nothing bearish to say about this breakout. Third, broken resistance (~10350) has turned into support and the DJIA is testing this level for the third time this year. Broken resistance often turns into support and a move back to this level is simply a throwback. |
|
| Figure 1: DJIA, point & figure. Despite the decline over the last few weeks, the Dow Jones industrials remains in a clear uptrend on the P&F chart with support close at hand. This is a 3 x 50 point & figure chart. "Three" means that the three-box reversal method is used. "Fifty" is the number of points for each box (X or O). The high-low range is used for calculation, not the close. |
| Graphic provided by: MetaStock. |
| Graphic provided by: Reuters Data. |
| |
| With the trend up and the DJIA at support, it would appear that a continuation of the uptrend is close at hand and traders may turn to a short-time frame to identify a short-term reversal. Should the DJIA break below 10,350, a P&F triple bottom support break would occur. This is a bearish signal that would call for further weakness. However, downside still looks limited as the blue trendline and support zone around 10,000 are close at hand. |
Arthur Hill is currently editor of TDTrader.com, a website specializing in trading strategies, sector/industry specific breadth stats and overall technical analysis. He passed the Society of Technical Analysts (STA London) diploma exam with distinction is a Certified Financial Technician (CFTe). Prior to TD Trader, he was the Chief Technical Analyst for Stockcharts.com and the main contributor to the ChartSchool.
| Title: | Editor |
| Company: | TDTrader.com |
| Address: | Willem Geetsstraat 17 |
| Mechelen, B2800 | |
| Phone # for sales: | 3215345465 |
| Website: | www.tdtrader.com |
| E-mail address: | arthurh@tdtrader.com |
Traders' Resource Links | |
| TDTrader.com has not added any product or service information to TRADERS' RESOURCE. | |
Click here for more information about our publications!
Comments
Date:�04/07/05Rank:�3Comment:�
Date:�04/12/05Rank:�5Comment:�
Date:�04/29/08Rank:�5Comment:�

Request Information From Our Sponsors
- VectorVest, Inc.
- Executive Premier Workshop
- One-Day Options Course
- OptionsPro
- Retirement Income Workshop
- Sure-Fire Trading Systems (VectorVest, Inc.)
- Trading as a Business Workshop
- VectorVest 7 EOD
- VectorVest 7 RealTime/IntraDay
- VectorVest AutoTester
- VectorVest Educational Services
- VectorVest OnLine
- VectorVest Options Analyzer
- VectorVest ProGraphics v6.0
- VectorVest ProTrader 7
- VectorVest RealTime Derby Tool
- VectorVest Simulator
- VectorVest Variator
- VectorVest Watchdog
- StockCharts.com, Inc.
- Candle Patterns
- Candlestick Charting Explained
- Intermarket Technical Analysis
- John Murphy on Chart Analysis
- John Murphy's Chart Pattern Recognition
- John Murphy's Market Message
- MurphyExplainsMarketAnalysis-Intermarket Analysis
- MurphyExplainsMarketAnalysis-Visual Analysis
- StockCharts.com
- Technical Analysis of the Financial Markets
- The Visual Investor