HOT TOPICS LIST
- MACD
- Fibonacci
- RSI
- Gann
- ADXR
- Stochastics
- Volume
- Triangles
- Futures
- Cycles
- Volatility
- ZIGZAG
- MESA
- Retracement
- Aroon
INDICATORS LIST
LIST OF TOPICS
PRINT THIS ARTICLE
by Jayanthi Gopalakrishnan
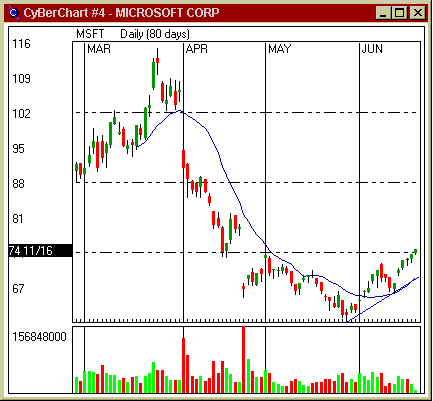
In a previous post I had mentioned that Microsoft Corp. (MSFT) was giving subtle signs of a reversal and may be a buy when it hits $74. At yesterday's close (6/19/00), the price came close to this point and surpassed it today. Does this mean it's a buy?
Position: N/A
Jayanthi Gopalakrishnan
PRINT THIS ARTICLE
Microsoft Corp. (MSFT) Hits $74
06/21/00 11:21:01 AMby Jayanthi Gopalakrishnan
In a previous post I had mentioned that Microsoft Corp. (MSFT) was giving subtle signs of a reversal and may be a buy when it hits $74. At yesterday's close (6/19/00), the price came close to this point and surpassed it today. Does this mean it's a buy?
Position: N/A
| The reason for this upward movement in price is due to positive news about the company. But if you look at the chart below you will see that technically prices are still above their trendline and the 15-day moving average has started to slope positively. The only variable, at this point, that is not favorable is volume. It is not as strong as it should be for a confirmed buy signal. |
| Given this scenario, I am going to consider two factors before jumping onboard for a long term buy. 1. A pullback to the 15-day moving average would be ideal but at this point it is difficult to predict if prices will fall to that level. Since the stock has shown positive movement for the last five to six days, I expect some type of pullback even if it's very slight. 2. Sometimes waiting for a pullback can result in missed opportunities, so the other factor I would watch is volume. If at any time there are signs of strong volume to the upside, I would enter my long position. |

|
| Microsoft Corp. (MSFT) is showing signs of a reversal. The question is, will it sustain? |
| Graphic provided by: CyBerCorp, Inc.. |
| |
| On 6/21/00 the stock of Microsoft Corp. (MSFT) was the most actively traded on the Nasdaq. Volume was well above average. I entered a long position at $79.00. |
| Title: | Editor |
| Company: | Technical Analysis of Stocks & Commodities |
| Address: | 4757 California Ave SW |
| Seattle, WA 98116 | |
| Website: | Traders.com |
| E-mail address: | Jayanthi@traders.com |
Traders' Resource Links | |
| Charting the Stock Market: The Wyckoff Method -- Books | |
| Working-Money.com -- Online Trading Services | |
| Traders.com Advantage -- Online Trading Services | |
| Technical Analysis of Stocks & Commodities -- Publications and Newsletters | |
| Working Money, at Working-Money.com -- Publications and Newsletters | |
| Traders.com Advantage -- Publications and Newsletters | |
| Professional Traders Starter Kit -- Software | |
Click here for more information about our publications!
Comments

Request Information From Our Sponsors
- StockCharts.com, Inc.
- Candle Patterns
- Candlestick Charting Explained
- Intermarket Technical Analysis
- John Murphy on Chart Analysis
- John Murphy's Chart Pattern Recognition
- John Murphy's Market Message
- MurphyExplainsMarketAnalysis-Intermarket Analysis
- MurphyExplainsMarketAnalysis-Visual Analysis
- StockCharts.com
- Technical Analysis of the Financial Markets
- The Visual Investor
- VectorVest, Inc.
- Executive Premier Workshop
- One-Day Options Course
- OptionsPro
- Retirement Income Workshop
- Sure-Fire Trading Systems (VectorVest, Inc.)
- Trading as a Business Workshop
- VectorVest 7 EOD
- VectorVest 7 RealTime/IntraDay
- VectorVest AutoTester
- VectorVest Educational Services
- VectorVest OnLine
- VectorVest Options Analyzer
- VectorVest ProGraphics v6.0
- VectorVest ProTrader 7
- VectorVest RealTime Derby Tool
- VectorVest Simulator
- VectorVest Variator
- VectorVest Watchdog
