

HOT TOPICS LIST
- MACD
- Fibonacci
- RSI
- Gann
- ADXR
- Stochastics
- Volume
- Triangles
- Futures
- Cycles
- Volatility
- ZIGZAG
- MESA
- Retracement
- Aroon
INDICATORS LIST
LIST OF TOPICS
PRINT THIS ARTICLE
by Arthur Hill
After a sharp decline in the last two to three months, a few chart signals have come together to suggest support for the Kuala Lumpur SE Composite.
Position: Hold
Arthur Hill
Arthur Hill is currently editor of TDTrader.com, a website specializing in trading strategies, sector/industry specific breadth stats and overall technical analysis. He passed the Society of Technical Analysts (STA London) diploma exam with distinction is a Certified Financial Technician (CFTe). Prior to TD Trader, he was the Chief Technical Analyst for Stockcharts.com and the main contributor to the ChartSchool.
PRINT THIS ARTICLE
ULTIMATE OSCILLATOR
The Kuala Lumpur Composite Enters Big Support Zone
04/06/05 08:07:49 AMby Arthur Hill
After a sharp decline in the last two to three months, a few chart signals have come together to suggest support for the Kuala Lumpur SE Composite.
Position: Hold
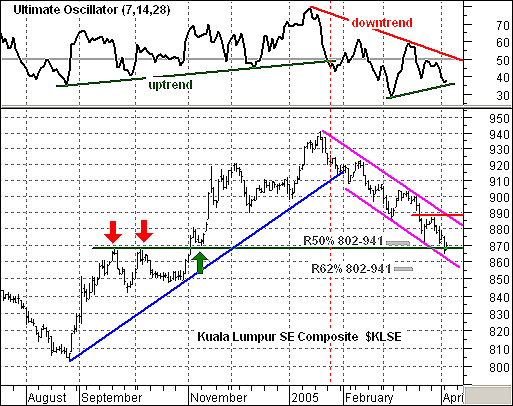
| As Figure 1 clearly shows, this export-driven Asian index has been tightly correlated with the Nasdaq. Both Kuala Lumpur SE Composite (KLSE) and Nasdaq bottomed in August, advanced from August to December, peaked in January, and declined to new lows in March. The Nasdaq formed a falling wedge decline over the last two to three months and the KLSE formed a falling price channel. |
| Despite a clear downtrend, two classic techniques point to support sooner rather than later. After an advance and reversal, technical analysts use retracements to estimate the extent of a correction. Typically, a correction will retrace 38-62% of the prior advance, with 50% acting as the midpoint. With the decline to around 870, the index has retraced 50% of its prior advance, and this is a logical spot for support. |
|
| Figure 1: Kuala Lumpur SE Composite. The export-driven Asian index KLSE has been tightly correlated with the Nasdaq. Both KLSE and Nasdaq bottomed in August, advanced from August to December, peaked in January, and declined to new lows in March. The Nasdaq formed a falling wedge decline over the last two to three months and the KLSE formed a falling price channel. |
| Graphic provided by: MetaStock. |
| Graphic provided by: Reuters Data. |
| |
| In addition to retracements, it is helpful to look for prior resistance breaks or consolidations to confirm support. The index established resistance at 870 with two reaction highs in September and October (red arrows). This resistance level turned into support in early November (green arrow), and an extension of this support level confirms support from the 50% retracement. |
| Support is just potential for now, and a bullish catalyst is required before thinking uptrend. At the very least, KLSE needs to break the upper trendline of the falling price channel and move above the late March high (~890). Turning to the "ultimate oscillator," we can see a positive divergence brewing within a downtrend (red trendline). This indicator needs to move into positive territory for confirmation and break the red trendline to turn bullish. |
Arthur Hill is currently editor of TDTrader.com, a website specializing in trading strategies, sector/industry specific breadth stats and overall technical analysis. He passed the Society of Technical Analysts (STA London) diploma exam with distinction is a Certified Financial Technician (CFTe). Prior to TD Trader, he was the Chief Technical Analyst for Stockcharts.com and the main contributor to the ChartSchool.
| Title: | Editor |
| Company: | TDTrader.com |
| Address: | Willem Geetsstraat 17 |
| Mechelen, B2800 | |
| Phone # for sales: | 3215345465 |
| Website: | www.tdtrader.com |
| E-mail address: | arthurh@tdtrader.com |
Traders' Resource Links | |
| TDTrader.com has not added any product or service information to TRADERS' RESOURCE. | |
Click here for more information about our publications!
Comments
Date:�04/07/05Rank:�4Comment:�

Request Information From Our Sponsors
- StockCharts.com, Inc.
- Candle Patterns
- Candlestick Charting Explained
- Intermarket Technical Analysis
- John Murphy on Chart Analysis
- John Murphy's Chart Pattern Recognition
- John Murphy's Market Message
- MurphyExplainsMarketAnalysis-Intermarket Analysis
- MurphyExplainsMarketAnalysis-Visual Analysis
- StockCharts.com
- Technical Analysis of the Financial Markets
- The Visual Investor
- VectorVest, Inc.
- Executive Premier Workshop
- One-Day Options Course
- OptionsPro
- Retirement Income Workshop
- Sure-Fire Trading Systems (VectorVest, Inc.)
- Trading as a Business Workshop
- VectorVest 7 EOD
- VectorVest 7 RealTime/IntraDay
- VectorVest AutoTester
- VectorVest Educational Services
- VectorVest OnLine
- VectorVest Options Analyzer
- VectorVest ProGraphics v6.0
- VectorVest ProTrader 7
- VectorVest RealTime Derby Tool
- VectorVest Simulator
- VectorVest Variator
- VectorVest Watchdog