HOT TOPICS LIST
- MACD
- Fibonacci
- RSI
- Gann
- ADXR
- Stochastics
- Volume
- Triangles
- Futures
- Cycles
- Volatility
- ZIGZAG
- MESA
- Retracement
- Aroon
INDICATORS LIST
LIST OF TOPICS
PRINT THIS ARTICLE
by Gary Grosschadl
This specialty apparel maker has broken out of two consolidation ranges. What are the upside targets?
Position: Buy
Gary Grosschadl
Independent Canadian equities trader and technical analyst based in Peterborough
Ontario, Canada.
PRINT THIS ARTICLE
FIBONACCI
Wet Seal Pushes Higher
04/07/05 02:13:15 PMby Gary Grosschadl
This specialty apparel maker has broken out of two consolidation ranges. What are the upside targets?
Position: Buy
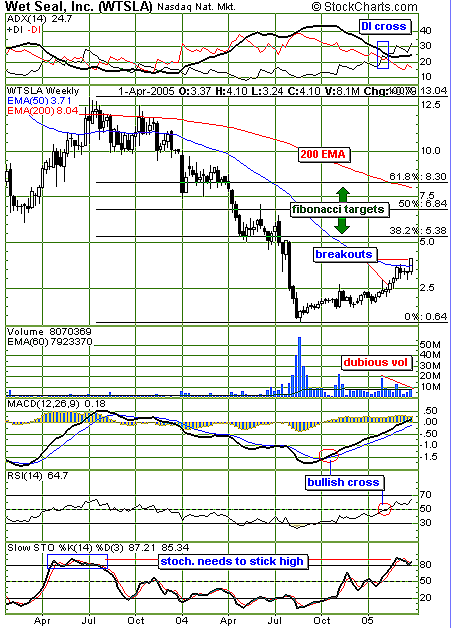
| After a year-long bearish correction, Wet Seal (WTSLA) finally bottomed out on an exceptional volume signal (more than 50 million shares traded). An eight-month consolidation, under the $2.50 level, ensued until this level was finally broken to the upside with a weekly close. A quick runup from $2.50 to $3.70 marked the first breakout. This was halted by overhead resistance from the 50-period exponential moving average (EMA). After a three-week consolidation, another breakout is occurring past this 50-period EMA. See Figure 1. |
| One way of determining upside targets from here is to use Fibonacci retracement levels. Using the low and high of the chart shown, I plotted the most common Fibonacci levels of roughly one third, one half, and two thirds. Stocks often have a tendency to retrace to those mathematical levels before making a reversal attempt. I pay particular attention to them if they relate to key previous levels of support and resistance, and this seems to be the case here. The 5.38 level relates to a previous congestion level, 6.84 being a shooting star candlestick, and finally the 8.30 price range being a combination of the previous congestion and the area near the oft-watched 200-period EMA. |

|
| Figure 1: Weekly chart shows further upside possibilities for Wet Seal. |
| Graphic provided by: StockCharts.com. |
| |
| Several indicators also merit comment. At the top of the chart, the bearish configuration of -DI dominating above +DI has finally switched positions, indicating a trend change giving the bulls power over the bears. The ideal configuration is +DI (bullish power) above -DI (bearish power), with a rising average directional movement index (ADX) ideally above 25 (currently 24.7). The moving average convergence/divergence (MACD) indicator gave an early bullish sign as it crossed over its signal line and then continued in a nice steady climb north. The relative strength index (RSI) also showed a bullish move past the key area of the 50 level. The chart does have some mixed signals. The volume is somewhat suspect, as breakouts are ideally confirmed with abnormal (big) volume and the stochastics indicator is now in overbought territory, being above the 80 level. However, it is possible for stochastics to "stick high" for a period of time when a strong uptrend is in place. This was demonstrated back in the summer of 2003. |
| Another period of consolidation here would not be a surprise. As long as recent support at ~ $3 holds, the bulls may prevail higher. As always, time will tell. For now, the bulls rule until proven otherwise. |
Independent Canadian equities trader and technical analyst based in Peterborough
Ontario, Canada.
| Website: | www.whatsonsale.ca/financial.html |
| E-mail address: | gwg7@sympatico.ca |
Click here for more information about our publications!
Comments
Date: 04/07/05Rank: 5Comment:

Request Information From Our Sponsors
- VectorVest, Inc.
- Executive Premier Workshop
- One-Day Options Course
- OptionsPro
- Retirement Income Workshop
- Sure-Fire Trading Systems (VectorVest, Inc.)
- Trading as a Business Workshop
- VectorVest 7 EOD
- VectorVest 7 RealTime/IntraDay
- VectorVest AutoTester
- VectorVest Educational Services
- VectorVest OnLine
- VectorVest Options Analyzer
- VectorVest ProGraphics v6.0
- VectorVest ProTrader 7
- VectorVest RealTime Derby Tool
- VectorVest Simulator
- VectorVest Variator
- VectorVest Watchdog
- StockCharts.com, Inc.
- Candle Patterns
- Candlestick Charting Explained
- Intermarket Technical Analysis
- John Murphy on Chart Analysis
- John Murphy's Chart Pattern Recognition
- John Murphy's Market Message
- MurphyExplainsMarketAnalysis-Intermarket Analysis
- MurphyExplainsMarketAnalysis-Visual Analysis
- StockCharts.com
- Technical Analysis of the Financial Markets
- The Visual Investor
