HOT TOPICS LIST
- MACD
- Fibonacci
- RSI
- Gann
- ADXR
- Stochastics
- Volume
- Triangles
- Futures
- Cycles
- Volatility
- ZIGZAG
- MESA
- Retracement
- Aroon
INDICATORS LIST
LIST OF TOPICS
PRINT THIS ARTICLE
by David Penn
The bearish reversal pattern that appeared on crude oil's weekly chart is now making an appearance on the daily chart.
Position: N/A
David Penn
Technical Writer for Technical Analysis of STOCKS & COMMODITIES magazine, Working-Money.com, and Traders.com Advantage.
PRINT THIS ARTICLE
REVERSAL
Crude's 2B Top Comes To The Dailies
04/05/05 07:42:15 AMby David Penn
The bearish reversal pattern that appeared on crude oil's weekly chart is now making an appearance on the daily chart.
Position: N/A
| Back in late March, I wrote an article for Traders.com Advantage that looked at technical arguments for lower crude oil prices ("Crude's High Altitude 2B Top," March 25, 2005). While I wasn't calling a top on crude oil myself, I wanted to respond to the notion that there was "nothing out there" to make people think that lower prices might be in the immediate future. Indeed, no less than Goldman Sachs recently published an analysis that called for crude oil prices to near $100 (over the next few years). |
| Nevertheless, an application of trader Victor Sperandeo's 2B top "rule" to the weekly chart of continuous crude oil futures suggested that significant weakness going forward in crude oil was indeed possible if prices were to (1) not show followthrough to the upside beyond the January 2005 highs and (2) then reverse to close below the low of the week in which crude oil make its previous high point. |

|
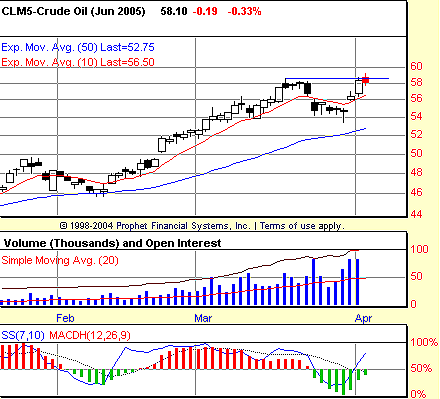
| Figure 1: June crude. If June crude fails to follow through in the wake of the intermediate low established in late March, then weakness going forward in crude oil could find the commodity looking for support near its 50-day exponential moving average once again. |
| Graphic provided by: Prophet Financial, Inc. |
| |
| On the weekly charts, the bulls are making progress--even if they haven't yet averted the danger of the weekly 2B top. The week of March 14 set the higher high vis-a-vis January, the week of March 21 provided the pullback that set up the 2B top, and the week of March 28 managed to keep crude from collapsing, but did little to provide the kind of followhrough to the upside that would have embolden bulls (and, equally important, chased the bears out of their short positions). |
| However, the daily chart of June crude futures shows that the bears have not yet let go of the chance to send crude oil futures in the opposite direction. In fact, the daily chart looks in many ways like the weekly chart did: a high, a sideways-to-lower correction, and a strong rally to new highs. So far, we are at "stage 2" of this potential 2B top. In other words, the new high has been set, and the bearish reaction has followed. The next thing to look for would be to see whether the bulls will be able to push the market back above the new, early April highs. |
| Does a breakout in oil mean a breakdown in stocks? If the 2B test marks a top in crude oil--even an intermediate one--will that mean an end to the stock market's March-into-April decline? As commonsensical as all of that speculation may be, it is difficult to anticipate how the movement of one will affect the other--even if oil and stocks seem to be moving inversely at present. Far better, at this point in the game, analyze crude oil and stocks on their own individual technical merits first and then, when both begin moving directionally in earnest, to consider what their separate trends might mean for each other going forward. |
Technical Writer for Technical Analysis of STOCKS & COMMODITIES magazine, Working-Money.com, and Traders.com Advantage.
| Title: | Technical Writer |
| Company: | Technical Analysis, Inc. |
| Address: | 4757 California Avenue SW |
| Seattle, WA 98116 | |
| Phone # for sales: | 206 938 0570 |
| Fax: | 206 938 1307 |
| Website: | www.Traders.com |
| E-mail address: | DPenn@traders.com |
Traders' Resource Links | |
| Charting the Stock Market: The Wyckoff Method -- Books | |
| Working-Money.com -- Online Trading Services | |
| Traders.com Advantage -- Online Trading Services | |
| Technical Analysis of Stocks & Commodities -- Publications and Newsletters | |
| Working Money, at Working-Money.com -- Publications and Newsletters | |
| Traders.com Advantage -- Publications and Newsletters | |
| Professional Traders Starter Kit -- Software | |
Click here for more information about our publications!
Comments
Date: 04/06/05Rank: 4Comment:
Date: 04/07/05Rank: 3Comment:

|

Request Information From Our Sponsors
- StockCharts.com, Inc.
- Candle Patterns
- Candlestick Charting Explained
- Intermarket Technical Analysis
- John Murphy on Chart Analysis
- John Murphy's Chart Pattern Recognition
- John Murphy's Market Message
- MurphyExplainsMarketAnalysis-Intermarket Analysis
- MurphyExplainsMarketAnalysis-Visual Analysis
- StockCharts.com
- Technical Analysis of the Financial Markets
- The Visual Investor
- VectorVest, Inc.
- Executive Premier Workshop
- One-Day Options Course
- OptionsPro
- Retirement Income Workshop
- Sure-Fire Trading Systems (VectorVest, Inc.)
- Trading as a Business Workshop
- VectorVest 7 EOD
- VectorVest 7 RealTime/IntraDay
- VectorVest AutoTester
- VectorVest Educational Services
- VectorVest OnLine
- VectorVest Options Analyzer
- VectorVest ProGraphics v6.0
- VectorVest ProTrader 7
- VectorVest RealTime Derby Tool
- VectorVest Simulator
- VectorVest Variator
- VectorVest Watchdog
