HOT TOPICS LIST
- MACD
- Fibonacci
- RSI
- Gann
- ADXR
- Stochastics
- Volume
- Triangles
- Futures
- Cycles
- Volatility
- ZIGZAG
- MESA
- Retracement
- Aroon
INDICATORS LIST
LIST OF TOPICS
PRINT THIS ARTICLE
by David Penn
The January lows held as the markets fell on April 1. But who were the markets making a fool of?
Position: N/A
David Penn
Technical Writer for Technical Analysis of STOCKS & COMMODITIES magazine, Working-Money.com, and Traders.com Advantage.
PRINT THIS ARTICLE
REVERSAL
Another Low, Another Punk Divergence
04/04/05 07:40:36 AMby David Penn
The January lows held as the markets fell on April 1. But who were the markets making a fool of?
Position: N/A
| One of my favorite short stories of all time is Leo Tolstoy's "How Much Land Does A Man Need?" It was one of his last, and tells the fabulist tale of an overly ambitious peasant who is given the opportunity to have, for the small fee of 1,000 rubles, all the land he can circumnavigate--walking--in a day. Unfortunately for Tolstoy's peasant, greed gets the better of him as he strains to cover as much territory as possible before sunset. When the peasant finally arrives at his starting place, having walked off a sizable plot of land, he is so exhausted that he collapses and dies. |
| The story ends with the peasant's servant burying his former employer, answering Tolstoy's cryptic question, "How much land does a man need?" with the answer, "Six feet from his head to his heels." |

|
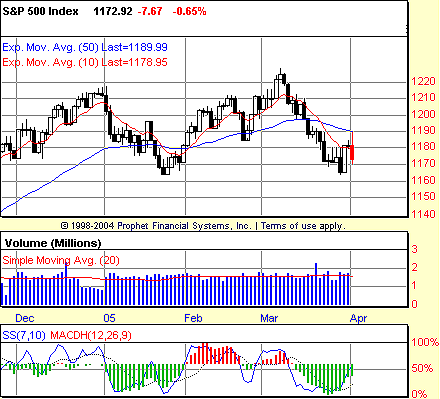
| Figure 1: S&P 500. Like the January lows, the lows in March lack the kind of obvious positive stochastic divergence that could get traders excited about an April rally. But how much of a divergence does a trader need? |
| Graphic provided by: Prophet Financial, Inc. |
| |
| I found myself thinking of Tolstoy's classic line when I looked at the recent lows in the Standard & Poor's 500 (Figure 1)--and found myself again lamenting the absence of the kind of clear-cut positive stochastic divergence that often anticipates a significant move to the upside. Why? Because, in part, the kind of greed that cost his ambitious peasant his life is the same sort of "set-up greed" that can end up costing a trader an opportunity. For example, there was no clear-cut positive stochastic divergence in January 2005 that would have set up a trader for the rally from late January into mid-February. Nevertheless, traders who did get long in late January likely made a solid profit (though not without some adventure, as previous lows were repeatedly violated by intraday swings). |
| So what do you do when your method seems untrue? One answer, in short, is "fake it." Rather than holding out for an immaculately pure positive stochastic divergence (per this example), consider giving your indicators the benefit of the doubt and give yourself an extra dose of managing-the-trade discipline. By this, I mean that whether or not there is a positive stochastic divergence accompanying the March 2005 low, no self-respecting trader would allow any speculatively long trade to violate those March lows. So even in the absence of the pure signal, there are parameters under which a long speculation off these lows can be made. Many traders spend a lot of time talking about the new indicator they've discovered that is so much better than this indicator or that indicator. My take on this has been that most traders will do themselves as much a favor by getting to know their indicators inside and out (even if not "especially" when they seem "untrue"), as opposed to launching themselves on a fruitless quest for the flawless indicator. Chances are, those traders will wind up as Tolstoy's peasant did, trying so much to have it all that he ended up with less than nothing. |
| All this said, the S&P 500 is not in a strong place right now, trading below the 50-day exponential moving average (EMA) and the 10-day EMA. A significant-enough down day on Monday will likely set up a moving average convergence/divergence histogram (MACDH) selling point, with the January 2005 lows as the most reasonable next destination. |
Technical Writer for Technical Analysis of STOCKS & COMMODITIES magazine, Working-Money.com, and Traders.com Advantage.
| Title: | Technical Writer |
| Company: | Technical Analysis, Inc. |
| Address: | 4757 California Avenue SW |
| Seattle, WA 98116 | |
| Phone # for sales: | 206 938 0570 |
| Fax: | 206 938 1307 |
| Website: | www.Traders.com |
| E-mail address: | DPenn@traders.com |
Traders' Resource Links | |
| Charting the Stock Market: The Wyckoff Method -- Books | |
| Working-Money.com -- Online Trading Services | |
| Traders.com Advantage -- Online Trading Services | |
| Technical Analysis of Stocks & Commodities -- Publications and Newsletters | |
| Working Money, at Working-Money.com -- Publications and Newsletters | |
| Traders.com Advantage -- Publications and Newsletters | |
| Professional Traders Starter Kit -- Software | |
Click here for more information about our publications!
Comments
Date: 04/04/05Rank: 2Comment:
Date: 04/05/05Rank: 5Comment:
Date: 04/09/05Rank: 2Comment:

Request Information From Our Sponsors
- StockCharts.com, Inc.
- Candle Patterns
- Candlestick Charting Explained
- Intermarket Technical Analysis
- John Murphy on Chart Analysis
- John Murphy's Chart Pattern Recognition
- John Murphy's Market Message
- MurphyExplainsMarketAnalysis-Intermarket Analysis
- MurphyExplainsMarketAnalysis-Visual Analysis
- StockCharts.com
- Technical Analysis of the Financial Markets
- The Visual Investor
- VectorVest, Inc.
- Executive Premier Workshop
- One-Day Options Course
- OptionsPro
- Retirement Income Workshop
- Sure-Fire Trading Systems (VectorVest, Inc.)
- Trading as a Business Workshop
- VectorVest 7 EOD
- VectorVest 7 RealTime/IntraDay
- VectorVest AutoTester
- VectorVest Educational Services
- VectorVest OnLine
- VectorVest Options Analyzer
- VectorVest ProGraphics v6.0
- VectorVest ProTrader 7
- VectorVest RealTime Derby Tool
- VectorVest Simulator
- VectorVest Variator
- VectorVest Watchdog
