HOT TOPICS LIST
- MACD
- Fibonacci
- RSI
- Gann
- ADXR
- Stochastics
- Volume
- Triangles
- Futures
- Cycles
- Volatility
- ZIGZAG
- MESA
- Retracement
- Aroon
INDICATORS LIST
LIST OF TOPICS
PRINT THIS ARTICLE
by Gary Grosschadl
If Bed Bath & Beyond breaks past its symmetrical triangle, a larger move can evolve.
Position: Hold
Gary Grosschadl
Independent Canadian equities trader and technical analyst based in Peterborough
Ontario, Canada.
PRINT THIS ARTICLE
SYMMETRICAL TRIANGLE
Will Bed & Bath Move Beyond?
04/01/05 10:33:05 AMby Gary Grosschadl
If Bed Bath & Beyond breaks past its symmetrical triangle, a larger move can evolve.
Position: Hold
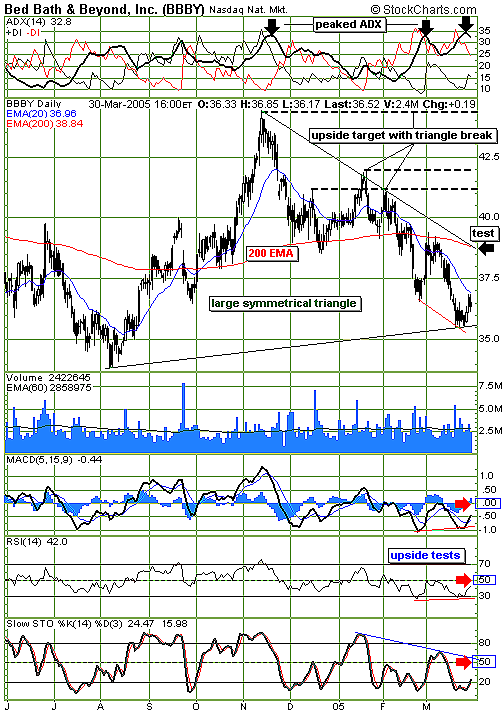
| Bed Bath & Beyond (BBBY) is attempting a bounce off a recent low of 35.50. Several upside tests will determine how far this move goes, the bigger test being the triangle's upper trendline. |
| By its nature, a symmetrical triangle is a neutral pattern until it breaks either way with ideally good volume conviction. The action of several indicators will help gauge and confirm where the price action may lead. Examined in Figure 1 is a trend strength indicator and several oscillators. |

|
| Figure 1: BBBY. This current symmetrical triangle may be tested to the upside. |
| Graphic provided by: StockCharts.com. |
| |
| At the top of the chart is the directional movement index (DMI). DMI helps provide an indication of how strong the directional movement (that is, the trend) is in a stock. It is composed of three components. The average directional movement index (ADX) rates the directional movement of a stock on a scale of zero to 100. Generally speaking, the higher the number, the more a stock is trending. The next two components show whether the bulls or bears have the upper hand. +DMI is a measure of upward or positive movement in a stock, while -DMI is a measure of negative or downward movement in a stock. A buy signal is generally given when +DMI crosses -DMI and a sell signal is given when -DMI crosses over +DMI. The ADX line is then used to measure the strength of these signals. Traders typically like to act upon these signals when the ADX is at a high number to avoid whipsaw signals. Another way of taking a trading signal is to wait until the ADX peaks at a relatively high level and reverses while the DIs converge. This would be taking an early position with the anticipation of the DIs reversing or at least being tested. Failure of the DIs to actually cross shows a "failure move" to overhead resistance. An actual cross shows the likelihood of a bigger move developing. In this chart, the interpretation would be an actual crossing of the DIs, either leading to or perhaps coinciding with a test of the upper trendline. |
| The lower indicators are all oscillators moving from overbought to oversold levels, although I see the lower two as having better-defined levels as compared to the moving average convergence/divergence (MACD). Note the positive divergences with the MACD and the relative strength index (RSI) as compared to the recent price action. This accurately foretells the current upmove, but it does not tell us how far the move will go. The red arrows point toward possible stall levels at key areas of these oscillators. Moving past these areas would indicate a larger move developing, leading to a larger test at the intersection of the oft-watched 200-day exponential moving average (EMA) and the upper triangle trendline. |
| Should a strong move ensue, leading to a high-volume breakout past that trendline, three possible upside target areas are shown at roughly $41, $42, and $44.50. Should the move reverse and break the lower triangle trendline, the previous low just below $34 is the next support level to be tested. |
Independent Canadian equities trader and technical analyst based in Peterborough
Ontario, Canada.
| Website: | www.whatsonsale.ca/financial.html |
| E-mail address: | gwg7@sympatico.ca |
Click here for more information about our publications!
Comments
Date: 04/01/05Rank: 5Comment:
Date: 04/09/05Rank: 4Comment:

Request Information From Our Sponsors
- VectorVest, Inc.
- Executive Premier Workshop
- One-Day Options Course
- OptionsPro
- Retirement Income Workshop
- Sure-Fire Trading Systems (VectorVest, Inc.)
- Trading as a Business Workshop
- VectorVest 7 EOD
- VectorVest 7 RealTime/IntraDay
- VectorVest AutoTester
- VectorVest Educational Services
- VectorVest OnLine
- VectorVest Options Analyzer
- VectorVest ProGraphics v6.0
- VectorVest ProTrader 7
- VectorVest RealTime Derby Tool
- VectorVest Simulator
- VectorVest Variator
- VectorVest Watchdog
- StockCharts.com, Inc.
- Candle Patterns
- Candlestick Charting Explained
- Intermarket Technical Analysis
- John Murphy on Chart Analysis
- John Murphy's Chart Pattern Recognition
- John Murphy's Market Message
- MurphyExplainsMarketAnalysis-Intermarket Analysis
- MurphyExplainsMarketAnalysis-Visual Analysis
- StockCharts.com
- Technical Analysis of the Financial Markets
- The Visual Investor
