HOT TOPICS LIST
- MACD
- Fibonacci
- RSI
- Gann
- ADXR
- Stochastics
- Volume
- Triangles
- Futures
- Cycles
- Volatility
- ZIGZAG
- MESA
- Retracement
- Aroon
INDICATORS LIST
LIST OF TOPICS
PRINT THIS ARTICLE
by Koos van der Merwe
The year 2005 should be a positive year, or so says the statistics since 1885. Not so, says a Nasdaq wave count.
Position: Sell
Koos van der Merwe
Has been a technical analyst since 1969, and has worked as a futures and options trader with First Financial Futures in Johannesburg, South Africa.
PRINT THIS ARTICLE
ELLIOTT WAVE
Nasdaq And Elliott
03/31/05 07:50:23 AMby Koos van der Merwe
The year 2005 should be a positive year, or so says the statistics since 1885. Not so, says a Nasdaq wave count.
Position: Sell
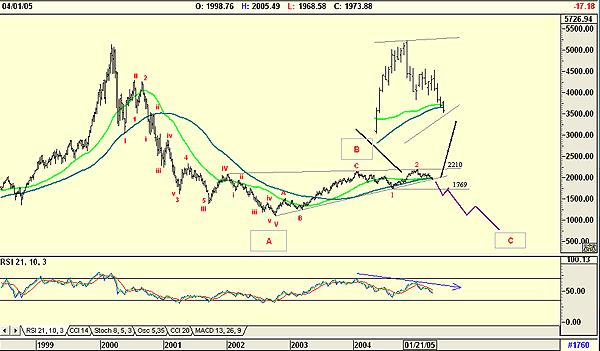
| Figure 1 is my primary wave count for the Nasdaq bear trend. Do note the following: a. I am suggesting that the Nasdaq is currently in a wave C down. My reason is because the bull run started in October 1974 and topped out in March 2000, a period of 26 years. With bear markets expected to be 38.2% (a Fibonacci number) of the rise--9.8 years, we should expect the final C wave to bottom in 2010. The suggestion in the chart of 500-odd is not confirmed. b. The two moving averages (MAs) look as if they may cross in the near future, suggesting a major sell. The MAs are light green, 40 period, dark green, 80 period. c. The relative strength index (RSI)--and here I have chosen a 21-period RSI--is showing a divergence sell signal. |
| The viability of the count will be confirmed should the Nasdaq break below the current support trendline, and strengthened should it break below the 1769 pivot point support. Of course, the entire count will change should the Nasdaq break above the triple-top resistance level at 2210. Let us hope that the latter become primary. |

|
| Figure 1: Nasdaq wave weekly chart. Here's the Nasdaq weekly chart showing the primary Elliott wave count. |
| Graphic provided by: AdvancedGET. |
| |
Has been a technical analyst since 1969, and has worked as a futures and options trader with First Financial Futures in Johannesburg, South Africa.
| Address: | 3256 West 24th Ave |
| Vancouver, BC | |
| Phone # for sales: | 6042634214 |
| E-mail address: | petroosp@gmail.com |
Click here for more information about our publications!
Comments
Date: 03/31/05Rank: 2Comment:
Date: 04/05/05Rank: 4Comment:

Request Information From Our Sponsors
- StockCharts.com, Inc.
- Candle Patterns
- Candlestick Charting Explained
- Intermarket Technical Analysis
- John Murphy on Chart Analysis
- John Murphy's Chart Pattern Recognition
- John Murphy's Market Message
- MurphyExplainsMarketAnalysis-Intermarket Analysis
- MurphyExplainsMarketAnalysis-Visual Analysis
- StockCharts.com
- Technical Analysis of the Financial Markets
- The Visual Investor
- VectorVest, Inc.
- Executive Premier Workshop
- One-Day Options Course
- OptionsPro
- Retirement Income Workshop
- Sure-Fire Trading Systems (VectorVest, Inc.)
- Trading as a Business Workshop
- VectorVest 7 EOD
- VectorVest 7 RealTime/IntraDay
- VectorVest AutoTester
- VectorVest Educational Services
- VectorVest OnLine
- VectorVest Options Analyzer
- VectorVest ProGraphics v6.0
- VectorVest ProTrader 7
- VectorVest RealTime Derby Tool
- VectorVest Simulator
- VectorVest Variator
- VectorVest Watchdog
