

HOT TOPICS LIST
- MACD
- Fibonacci
- RSI
- Gann
- ADXR
- Stochastics
- Volume
- Triangles
- Futures
- Cycles
- Volatility
- ZIGZAG
- MESA
- Retracement
- Aroon
INDICATORS LIST
LIST OF TOPICS
PRINT THIS ARTICLE
by Kevin Hopson
Key resistance levels are holding for the volatility index, but the long-term pattern indicates an eventual breakout.
Position: N/A
Kevin Hopson
Kevin has been a technical analyst for roughly 10 years now. Previously, Kevin owned his own business and acted as a registered investment advisor, specializing in energy. He was also a freelance oil analyst for Orient Trading Co., a commodity futures trading firm in Japan. Kevin is currently a freelance writer.
PRINT THIS ARTICLE
VOLATILITY
Long-Term Volatility Pattern A Concern
03/28/05 08:13:24 AMby Kevin Hopson
Key resistance levels are holding for the volatility index, but the long-term pattern indicates an eventual breakout.
Position: N/A
| The last two times I touched on the CBOE Volatility Index (VIX), I took a short-term approach. More specifically, I highlighted support and resistance levels that would likely act as temporary selling and rallying points, respectively, for the Standard & Poor's 500 (SPX). Up to this point, key resistance levels for the VIX have held, which has kept the SPX from hitting year-to-date lows. However, if you take a look at the long-term VIX chart, it may only be a matter of time before stocks experience a significant selloff. |
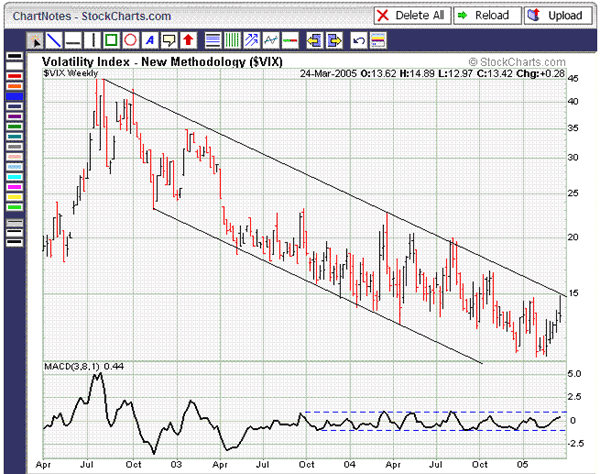
| For example, note in the three-year weekly chart (Figure 1) how prices have been stuck in a falling channel formation, as illustrated by the black trendlines. The VIX recently bumped up against the summer 2002 downtrend line (top channel line), which proceeded to turn back prices. If you take a look at the moving average convergence/divergence (MACD), you will note that this indicator has been moving sideways since October 2003, despite the fact that the volatility index has continued to hit new lows. This is a bullish divergence, which indicates the likelihood that a long-term bottom is being put in. |
|
| Figure 1: VIX weekly. Note how prices have been stuck in a falling channel formation, as illustrated by the black trendlines. |
| Graphic provided by: StockCharts.com. |
| |
If you turn your attention to the six-month daily chart (Figure 2), you will note that prices recently met resistance in the $14.30 to $15.00 range. Not only is this the site of the index's long-term downtrend line (as mentioned), but it is also the site of January's high, the 1A channel line and the blue median line. In other words, a move above $15.00 will likely lead to a spike in volatility levels. As a result, I would keep a close eye on this price level, as a breakout could spur major selling pressure in equities.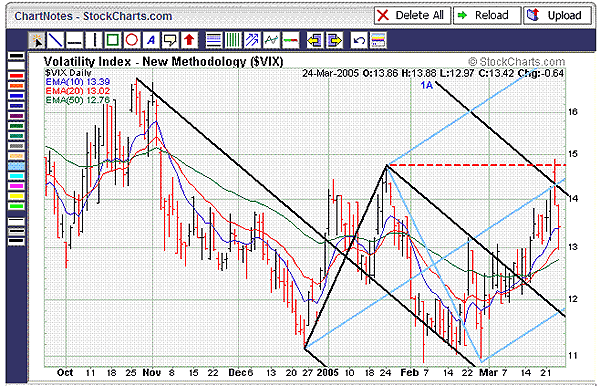 Figure 2: VIX daily chart. Note that prices recently met resistance in the $14.30 to $15.00 range. |
Kevin has been a technical analyst for roughly 10 years now. Previously, Kevin owned his own business and acted as a registered investment advisor, specializing in energy. He was also a freelance oil analyst for Orient Trading Co., a commodity futures trading firm in Japan. Kevin is currently a freelance writer.
| Glen Allen, VA | |
| E-mail address: | hopson_1@yahoo.com |
Click here for more information about our publications!
Comments
Date:�03/29/05Rank:�5Comment:�
Date:�03/29/05Rank:�3Comment:�
Date:�04/06/05Rank:�3Comment:�

Request Information From Our Sponsors
- StockCharts.com, Inc.
- Candle Patterns
- Candlestick Charting Explained
- Intermarket Technical Analysis
- John Murphy on Chart Analysis
- John Murphy's Chart Pattern Recognition
- John Murphy's Market Message
- MurphyExplainsMarketAnalysis-Intermarket Analysis
- MurphyExplainsMarketAnalysis-Visual Analysis
- StockCharts.com
- Technical Analysis of the Financial Markets
- The Visual Investor
- VectorVest, Inc.
- Executive Premier Workshop
- One-Day Options Course
- OptionsPro
- Retirement Income Workshop
- Sure-Fire Trading Systems (VectorVest, Inc.)
- Trading as a Business Workshop
- VectorVest 7 EOD
- VectorVest 7 RealTime/IntraDay
- VectorVest AutoTester
- VectorVest Educational Services
- VectorVest OnLine
- VectorVest Options Analyzer
- VectorVest ProGraphics v6.0
- VectorVest ProTrader 7
- VectorVest RealTime Derby Tool
- VectorVest Simulator
- VectorVest Variator
- VectorVest Watchdog