HOT TOPICS LIST
- MACD
- Fibonacci
- RSI
- Gann
- ADXR
- Stochastics
- Volume
- Triangles
- Futures
- Cycles
- Volatility
- ZIGZAG
- MESA
- Retracement
- Aroon
INDICATORS LIST
LIST OF TOPICS
PRINT THIS ARTICLE
by Gary Grosschadl
A candlestick warning of three black crows reminds traders of two bearish patterns evolving for the DJIA.
Position: Sell
Gary Grosschadl
Independent Canadian equities trader and technical analyst based in Peterborough
Ontario, Canada.
PRINT THIS ARTICLE
CANDLESTICK CHARTING
Does Bad News Have Wings? Bears & Crows Eyeing DJIA
03/28/05 12:13:10 PMby Gary Grosschadl
A candlestick warning of three black crows reminds traders of two bearish patterns evolving for the DJIA.
Position: Sell
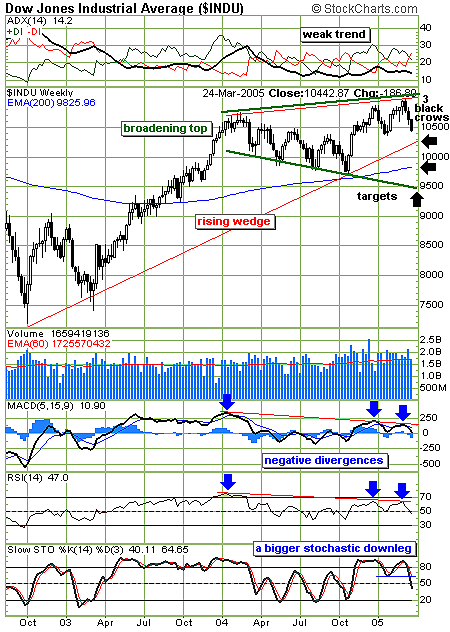
| "Three black crows" is a potential bearish candlestick pattern referring to three consecutive black (down) candlesticks. To quote Steve Nison (author of JAPANESE CANDLESTICK CHARTING TECHNIQUES): "The three black crows presage lower prices if they appear at high price levels or after a mature advance. The Japanese have an expression, that "bad news has wings." Ideally, the three candles should close at or near their lows and should also open within the prior session's real body. A similar but rarer pattern called "identical three crows" occurs when the open and close between the candles match up very closely. This is considered especially bearish, and this is what the weekly Dow Jones Industrial Average (Figure 1) now shows. |
| This does not necessarily mean an immediate drop in price moves often come in a series of fits and starts, but it does hint at a larger move down over time. On the daily chart (not shown), the Dow Jones Industrial Average (DJIA) has come down to a trading target (for some) being the 200-day exponential moving average (EMA). So a pause or some sort of short-term bounce may occur. What follows this may be more telling as the crows may still decide to fly south. |

|
| Figure 1: DJIA weekly. Bearish candle warning may lead to tests of lower limits. |
| Graphic provided by: StockCharts.com. |
| |
| For the pattern recognition trader, two potentially bearish formations may be in play: a large rising wedge and a broadening top. Rising wedges are a bearish formation despite their upward angle. It is the break of the lower trendline that announces the failure move to the downside. This trendline area close to 10,300 should be carefully watched as either another bounce move (delaying the overall downside implications) or the start of a more serious decline. This would lead us to two other downside targets. The oft-watched 200-period moving average (I prefer the exponential moving average [EMA] with its more sensitive weighting) currently at 9825 and the bottom trendline of the broadening pattern. |
| A broadening top formation has a series of higher highs and lower lows and is considered fulfilled when it breaks to the downside, outside of the lower trendline. Because it is such a wide-reaching pattern, a mere touch or test of the lower trendline has substantial implications even without a downside break. This lower mark at ~ 9500 would represent an almost 1,000-point drop. Should a downside break occur, the height of the pattern subtracted from the downside breakout point gives you the approximate target. This could challenge the lows of 2003 at ~ 7500 or at least 8000. |
| Several indicators are worthy of comment. The average directional movment index (ADX) shows a weak trend in place, reflecting the lack of a serious bull challenge to stay above 10,500. The DIs have now crossed, showing added bearishness here. For confirmation of a bigger downward pull developing, the ADX would have to reverse slope and head toward 20 and higher. The moving average convergence/divergence (MACD) and the relative strength index (RSI) also agree with the crows' warning via their negative divergences. The stochastics oscillator also hints at a bigger downleg under way. |
Independent Canadian equities trader and technical analyst based in Peterborough
Ontario, Canada.
| Website: | www.whatsonsale.ca/financial.html |
| E-mail address: | gwg7@sympatico.ca |
Click here for more information about our publications!
Comments
Date: 03/29/05Rank: 5Comment:
Date: 03/29/05Rank: 5Comment:
Date: 03/29/05Rank: 5Comment:
Date: 04/03/05Rank: 4Comment:
Date: 04/09/05Rank: 4Comment:

Request Information From Our Sponsors
- StockCharts.com, Inc.
- Candle Patterns
- Candlestick Charting Explained
- Intermarket Technical Analysis
- John Murphy on Chart Analysis
- John Murphy's Chart Pattern Recognition
- John Murphy's Market Message
- MurphyExplainsMarketAnalysis-Intermarket Analysis
- MurphyExplainsMarketAnalysis-Visual Analysis
- StockCharts.com
- Technical Analysis of the Financial Markets
- The Visual Investor
- VectorVest, Inc.
- Executive Premier Workshop
- One-Day Options Course
- OptionsPro
- Retirement Income Workshop
- Sure-Fire Trading Systems (VectorVest, Inc.)
- Trading as a Business Workshop
- VectorVest 7 EOD
- VectorVest 7 RealTime/IntraDay
- VectorVest AutoTester
- VectorVest Educational Services
- VectorVest OnLine
- VectorVest Options Analyzer
- VectorVest ProGraphics v6.0
- VectorVest ProTrader 7
- VectorVest RealTime Derby Tool
- VectorVest Simulator
- VectorVest Variator
- VectorVest Watchdog
