HOT TOPICS LIST
- MACD
- Fibonacci
- RSI
- Gann
- ADXR
- Stochastics
- Volume
- Triangles
- Futures
- Cycles
- Volatility
- ZIGZAG
- MESA
- Retracement
- Aroon
INDICATORS LIST
LIST OF TOPICS
PRINT THIS ARTICLE
by David Penn
Two-thirds of the way through a reversal pattern, May meal develops a running negative stochastic divergence.
Position: N/A
David Penn
Technical Writer for Technical Analysis of STOCKS & COMMODITIES magazine, Working-Money.com, and Traders.com Advantage.
PRINT THIS ARTICLE
HEAD & SHOULDERS
Will A Head And Shoulders Top Stop The Bean Meal Bull?
03/28/05 12:21:12 PMby David Penn
Two-thirds of the way through a reversal pattern, May meal develops a running negative stochastic divergence.
Position: N/A
| If there is anything to the notion that an easily observed--or prematurely observed--chart pattern is not likely to work out as expected (for instance, that massive head and shoulders top in the Standard & Poor's 500 from 1988 that so excited long-term bears back in 2002), then the head and shoulders top in May soybean meal is probably not destined for greatness. |
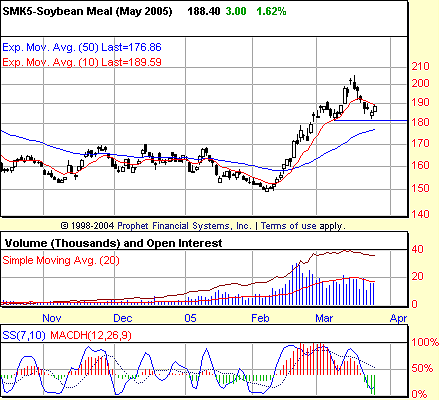
| Nevertheless, in the context of the rally that preceded it--a nearly-six week advance from the February lows near 150 to a mid-March high just north of 200--the potential head and shoulders top now developing is significant enough in its own right. Measuring about 20 points with a neckline at about 180, a reversal from a successfully completed H&S top could send May meal futures tumbling back whence they came--or close enough to it to bring tears to the eyes of meal bulls. |

|
| Figure 1: As the 50-point rally unfolds over the course of February and March 2005, higher highs in May soybean meal are met with lower highs in the 7,10 stochastic--a classic sign of waning upside momentum. |
| Graphic provided by: Prophet Financial, Inc. |
| |
| Again, the head and shoulders top in May bean meal is not completed. What remains is the right shoulder, which could be formed if SMK5 were to find short-term resistance in the 190 area, then reverse and move below the neckline at 180. Currently, SMK5 is significantly oversold; thus, a bounce--as opposed to further immediate declines--is a distinct possibility. |
| However, the pattern in the 7,10 stochastic is not especially supportive of higher meal prices at this time. Note how as the May soybean meal contract is making higher highs in late February, early March, and again in mid-March, the stochastic is matching those higher highs with a pattern of lower highs. As I've written before, negative stochastic divergences--even running or multiple stochastic divergences--like these are as likely to resolve themselves in sideways prices as they are to lead to sharply lower prices. |
| But the excesses of the rally will be worked off one way or the other. At the mid-March peak, SMK5 was more than 10 points above its 10-day exponential moving average (EMA), which itself was more than 10 points above its 50-day EMA. This is precisely the context in which markets become overextended to the upside and vulnerable to reversal. |
Technical Writer for Technical Analysis of STOCKS & COMMODITIES magazine, Working-Money.com, and Traders.com Advantage.
| Title: | Technical Writer |
| Company: | Technical Analysis, Inc. |
| Address: | 4757 California Avenue SW |
| Seattle, WA 98116 | |
| Phone # for sales: | 206 938 0570 |
| Fax: | 206 938 1307 |
| Website: | www.Traders.com |
| E-mail address: | DPenn@traders.com |
Traders' Resource Links | |
| Charting the Stock Market: The Wyckoff Method -- Books | |
| Working-Money.com -- Online Trading Services | |
| Traders.com Advantage -- Online Trading Services | |
| Technical Analysis of Stocks & Commodities -- Publications and Newsletters | |
| Working Money, at Working-Money.com -- Publications and Newsletters | |
| Traders.com Advantage -- Publications and Newsletters | |
| Professional Traders Starter Kit -- Software | |
Click here for more information about our publications!
Comments
Date: 03/29/05Rank: 5Comment:
Date: 03/29/05Rank: 3Comment:

Request Information From Our Sponsors
- VectorVest, Inc.
- Executive Premier Workshop
- One-Day Options Course
- OptionsPro
- Retirement Income Workshop
- Sure-Fire Trading Systems (VectorVest, Inc.)
- Trading as a Business Workshop
- VectorVest 7 EOD
- VectorVest 7 RealTime/IntraDay
- VectorVest AutoTester
- VectorVest Educational Services
- VectorVest OnLine
- VectorVest Options Analyzer
- VectorVest ProGraphics v6.0
- VectorVest ProTrader 7
- VectorVest RealTime Derby Tool
- VectorVest Simulator
- VectorVest Variator
- VectorVest Watchdog
- StockCharts.com, Inc.
- Candle Patterns
- Candlestick Charting Explained
- Intermarket Technical Analysis
- John Murphy on Chart Analysis
- John Murphy's Chart Pattern Recognition
- John Murphy's Market Message
- MurphyExplainsMarketAnalysis-Intermarket Analysis
- MurphyExplainsMarketAnalysis-Visual Analysis
- StockCharts.com
- Technical Analysis of the Financial Markets
- The Visual Investor
