HOT TOPICS LIST
- MACD
- Fibonacci
- RSI
- Gann
- ADXR
- Stochastics
- Volume
- Triangles
- Futures
- Cycles
- Volatility
- ZIGZAG
- MESA
- Retracement
- Aroon
INDICATORS LIST
LIST OF TOPICS
PRINT THIS ARTICLE
by David Penn
The rally in the 10-year Treasury note yield nears its second month amid growing negative stochastic divergences.
Position: N/A
David Penn
Technical Writer for Technical Analysis of STOCKS & COMMODITIES magazine, Working-Money.com, and Traders.com Advantage.
PRINT THIS ARTICLE
REVERSAL
The 10-Year Note's Temporary Top
03/25/05 01:56:36 PMby David Penn
The rally in the 10-year Treasury note yield nears its second month amid growing negative stochastic divergences.
Position: N/A
| The last time I wrote about 10-year Treasuries was in January. That article, "Bad News Bonds?" (Traders.com Advantage; January 7, 2005), took a long-term look at what I called the "Death Star-like diamond top" in the 10-year--a top that threatened significant losses for T-note bulls. |
| Since then, the bond bulls have been bloodied if not beaten. The breakout low from that diamond top--a low established in June 2004--has yet to be exceeded by T-note losses in 2005. Continuous futures for the 10-year stood at about 111-15 in early January and are closer to 108-10 now in late March. Yields, correspondingly, have risen from about 4.3% to as high as 4.6%. |

|
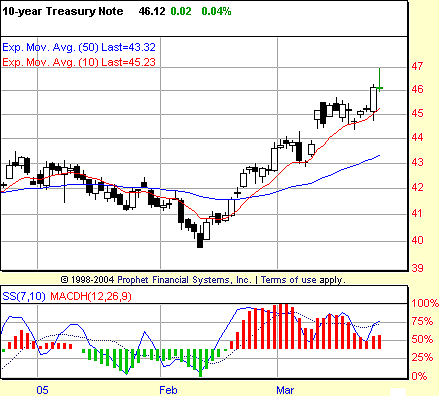
| Figure 1: 10-Year Treasury Note. A positive stochastic divergence between the January and February lows marked the beginning of the rally in the $TNX. Will a series of negative stochastic divergences in late February and March help traders anticipate the rally's end? |
| Graphic provided by: Prophet Financial, Inc. |
| |
| Imagine a stock gaining six points in a little over a month and you'll have a sense of the strength of the rally in the $TNX--strength that should give pause to anyone not discounting the bond bear market that has been in effect since the top back in June 2003 (the top of the "Death Star-like" diamond formation mentioned earlier). Yet nothing goes up forever, and even the strongest rallies will require time to consolidate their gains if the rally is destined to move still higher. And it is in this context that the multiple or "running" negative stochastic divergences in March are noteworthy. The first of these negative divergences completed in mid-March, shortly after the $TNX gapped up into a consolidation around the 4.5% level. This negative stochastic divergence did not lead to a sharp selloff, but did lead to sideways action for another trading week before $TNX could resume its advance. I've mentioned before with regard to these kind of negative divergences using the 7,10 stochastic that they can result in sideways as well as sharply lower price action. |
| For what it's worth, the primary setup I use to analyze the market would have produced a scratch trade from this first negative stochastic divergence--a short signal on March 14 at 44.86 and confirmed on March 15, with a trailing high's exit at the open on March 18 (March 18 opening above the previous day's high). It is possible that the second divergence won't fully develop. This would require what currently appears to be the second consecutively lower stochastic peak since mid-February to reverse and curl back up as guided by even higher levels in the $TNX. At present, this looks a little unlikely in the immediate term due to the shooting star candlestick of Wednesday, March 23 (the day after the Federal Reserve raised the cash rate to 2.75%). Nevertheless, that is the task to be completed if the $TNX is to avoid another bearish negative stochastic divergence. |
| Again, sharply downward action in response to a negative stochastic divergence is not always the case. A sideways, week-long bear market--as was the case with the previous negative stochastic divergence--is just as probable. But given the combination of factors--from the "running" negative stochastic divergence to the growing spread between current levels (intraday as high as 4.7%), the 10-day exponential moving average (just north of 4.5%), and the 50-day exponential moving average (just north of 4.3%)--it is hard NOT to see some weakness in $TNX in the near term. |
Technical Writer for Technical Analysis of STOCKS & COMMODITIES magazine, Working-Money.com, and Traders.com Advantage.
| Title: | Technical Writer |
| Company: | Technical Analysis, Inc. |
| Address: | 4757 California Avenue SW |
| Seattle, WA 98116 | |
| Phone # for sales: | 206 938 0570 |
| Fax: | 206 938 1307 |
| Website: | www.Traders.com |
| E-mail address: | DPenn@traders.com |
Traders' Resource Links | |
| Charting the Stock Market: The Wyckoff Method -- Books | |
| Working-Money.com -- Online Trading Services | |
| Traders.com Advantage -- Online Trading Services | |
| Technical Analysis of Stocks & Commodities -- Publications and Newsletters | |
| Working Money, at Working-Money.com -- Publications and Newsletters | |
| Traders.com Advantage -- Publications and Newsletters | |
| Professional Traders Starter Kit -- Software | |
Click here for more information about our publications!
Comments
Date: 03/25/05Rank: 3Comment:
Date: 03/29/05Rank: 5Comment:

Request Information From Our Sponsors
- VectorVest, Inc.
- Executive Premier Workshop
- One-Day Options Course
- OptionsPro
- Retirement Income Workshop
- Sure-Fire Trading Systems (VectorVest, Inc.)
- Trading as a Business Workshop
- VectorVest 7 EOD
- VectorVest 7 RealTime/IntraDay
- VectorVest AutoTester
- VectorVest Educational Services
- VectorVest OnLine
- VectorVest Options Analyzer
- VectorVest ProGraphics v6.0
- VectorVest ProTrader 7
- VectorVest RealTime Derby Tool
- VectorVest Simulator
- VectorVest Variator
- VectorVest Watchdog
- StockCharts.com, Inc.
- Candle Patterns
- Candlestick Charting Explained
- Intermarket Technical Analysis
- John Murphy on Chart Analysis
- John Murphy's Chart Pattern Recognition
- John Murphy's Market Message
- MurphyExplainsMarketAnalysis-Intermarket Analysis
- MurphyExplainsMarketAnalysis-Visual Analysis
- StockCharts.com
- Technical Analysis of the Financial Markets
- The Visual Investor
