HOT TOPICS LIST
- MACD
- Fibonacci
- RSI
- Gann
- ADXR
- Stochastics
- Volume
- Triangles
- Futures
- Cycles
- Volatility
- ZIGZAG
- MESA
- Retracement
- Aroon
INDICATORS LIST
LIST OF TOPICS
PRINT THIS ARTICLE
by Arthur Hill
The small-cap dominated Russell 2000 index, which started underperforming the S&P 500 in December, looks ripe for further downside.
Position: Sell
Arthur Hill
Arthur Hill is currently editor of TDTrader.com, a website specializing in trading strategies, sector/industry specific breadth stats and overall technical analysis. He passed the Society of Technical Analysts (STA London) diploma exam with distinction is a Certified Financial Technician (CFTe). Prior to TD Trader, he was the Chief Technical Analyst for Stockcharts.com and the main contributor to the ChartSchool.
PRINT THIS ARTICLE
REL. STR COMPARATIVE
Small Caps Lagging Large Caps
03/25/05 01:55:04 PMby Arthur Hill
The small-cap dominated Russell 2000 index, which started underperforming the S&P 500 in December, looks ripe for further downside.
Position: Sell
| The price relative is a ratio plot that compares the performance of one security against another. In this case, the Russell 2000 ($RUT) is being compared to the Standard & Poor's 500 (the ratio equals $RUT divided by $SPX). The price relative rises when RUT outperforms and falls when RUT underperforms. The Russell 2000 represents small-cap stocks while the S&P 500 represents large-cap stocks. As such, this ratio plot indicates when small caps are in or out of favor and when large caps are in or out of favor. |
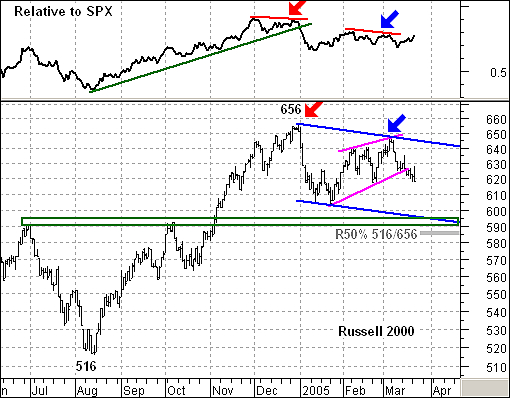
| The price relative moved higher from mid-August to early December, when small caps were in favor and outperforming. The index moved to a new high at the end of December (at the 656 level), but the price relative failed to exceed its prior high (red arrows). This negative divergence signaled the beginning of the end of small-cap outperformance and large caps were coming back into favor. Another negative divergence formed in the February-March period as the index moved to a new reaction high in early March, but the price relative failed to exceed its prior high (blue arrows). |

|
| Figure 1: Russell 2000. The price relative moved higher from mid-August to early December, when small caps were in favor and outperforming. The index moved to a new high at the end of December, but the price relative failed to exceed its prior high (red arrows). This negative divergence signaled the beginning of the end of small-cap outperformance and large caps were coming back into favor. Another negative divergence formed in the February-March period as the index moved to a new reaction high in early March, but the price relative failed to exceed its prior high (blue arrows). |
| Graphic provided by: MetaStock. |
| Graphic provided by: Reuters Data. |
| |
| Turning to the price chart in Figure 1, the index formed a rising wedge from late January to early March and recently broke below the lower trendline. This signals a continuation of the January decline, and the initial downside target is around 590. A 50% retracement of the prior advance (516-656), broken resistance, and the lower channel trendline (in blue) all converge on 590 to confirm the target. |
Arthur Hill is currently editor of TDTrader.com, a website specializing in trading strategies, sector/industry specific breadth stats and overall technical analysis. He passed the Society of Technical Analysts (STA London) diploma exam with distinction is a Certified Financial Technician (CFTe). Prior to TD Trader, he was the Chief Technical Analyst for Stockcharts.com and the main contributor to the ChartSchool.
| Title: | Editor |
| Company: | TDTrader.com |
| Address: | Willem Geetsstraat 17 |
| Mechelen, B2800 | |
| Phone # for sales: | 3215345465 |
| Website: | www.tdtrader.com |
| E-mail address: | arthurh@tdtrader.com |
Traders' Resource Links | |
| TDTrader.com has not added any product or service information to TRADERS' RESOURCE. | |
Click here for more information about our publications!
Comments
Date: 03/25/05Rank: 4Comment:

Request Information From Our Sponsors
- StockCharts.com, Inc.
- Candle Patterns
- Candlestick Charting Explained
- Intermarket Technical Analysis
- John Murphy on Chart Analysis
- John Murphy's Chart Pattern Recognition
- John Murphy's Market Message
- MurphyExplainsMarketAnalysis-Intermarket Analysis
- MurphyExplainsMarketAnalysis-Visual Analysis
- StockCharts.com
- Technical Analysis of the Financial Markets
- The Visual Investor
- VectorVest, Inc.
- Executive Premier Workshop
- One-Day Options Course
- OptionsPro
- Retirement Income Workshop
- Sure-Fire Trading Systems (VectorVest, Inc.)
- Trading as a Business Workshop
- VectorVest 7 EOD
- VectorVest 7 RealTime/IntraDay
- VectorVest AutoTester
- VectorVest Educational Services
- VectorVest OnLine
- VectorVest Options Analyzer
- VectorVest ProGraphics v6.0
- VectorVest ProTrader 7
- VectorVest RealTime Derby Tool
- VectorVest Simulator
- VectorVest Variator
- VectorVest Watchdog
