

HOT TOPICS LIST
- MACD
- Fibonacci
- RSI
- Gann
- ADXR
- Stochastics
- Volume
- Triangles
- Futures
- Cycles
- Volatility
- ZIGZAG
- MESA
- Retracement
- Aroon
INDICATORS LIST
LIST OF TOPICS
PRINT THIS ARTICLE
by David Penn
Bulls jump up to get beat down as an early breakout to the upside leads to a late afternoon market meltdown.
Position: N/A
David Penn
Technical Writer for Technical Analysis of STOCKS & COMMODITIES magazine, Working-Money.com, and Traders.com Advantage.
PRINT THIS ARTICLE
THE DIAMOND
The S&P 500's Intraday Diamond
03/24/05 09:27:10 AMby David Penn
Bulls jump up to get beat down as an early breakout to the upside leads to a late afternoon market meltdown.
Position: N/A
| As the diamond pattern in the intraday Standard & Poor's 500 developed late in March, my first instinct was to figure out how to jibe this consolidation pattern with the just-barely-more-long-term bearish implications of the head and shoulders top in the intraday S&P 500 (see my "S&P 500's 90-Minute Head and Shoulders Top," March 22, 2005, Traders.com Advantage). In that piece, I suggested two things: first, that the downside implications of the head and shoulders pattern pointed to a minimum downside to about 1170. |
| Second, the decline from the intraday H&S top (very clear on 90-minute charts, by the way) was starting to be accompanied by positive stochastic divergences. While none of these divergences in and of themselves had resulted in a very tradable rally (arguably, the bounce on March 14 was one), they did serve to put me on alert that the correction from the H&S top would not last forever and, in fact, would most likely end at the moment when the bearishness seemed most overwhelming. |
|
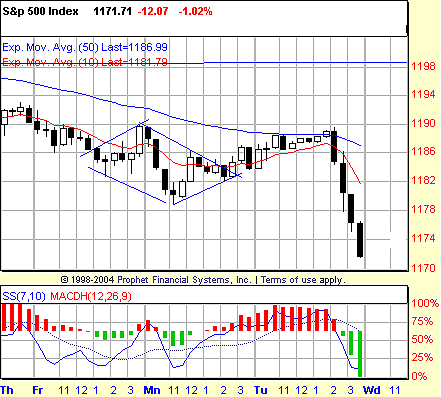
| Figure 1: S&P 500. Note how the initial breakout from the diamond pattern finds resistance at the top of the diamond pattern late on Tuesday. The reaction to that resistance was both sharp and swift. |
| Graphic provided by: Prophet Financial, Inc. |
| |
| So how does a near 20-point drop in the last two hours of trading on March 22 qualify on the "overwhelming bearishness" scale? In his book ENCYCLOPEDIA OF CHART PATTERNS, noted technical analyst and "Technical Analysis of STOCKS & COMMODITIES" contributor Thomas Bulkowski spends a great deal of time talking about diamond tops and bottoms, but appears to relegate "diamond continuations" to the category of failed tops and bottoms (that is, a diamond bottom that did not turn out to be a bottom after all). As someone who perhaps finds more diamond patterns than the average technical analyst might, I've increasingly begun to consider diamond consolidations to serve more or less the same sort of function as a symmetrical triangle--especially with regard to the directional ambiguity of the breakout or breakdown. |
| Nevertheless, in the context of the intraday head and shoulders top, it seemed to me that the odds of more downside outweighed the likelihood of significant gains in the S&P 500 over the near term. This viewpoint was hardly unshakable. As the S&P 500 began to move slowly up and out of the diamond pattern over the course of Tuesday, March 22, it started to look as if the diamond pattern was actually marking a bottom. But one reason I shied away from a diamond bottom had to do with the pattern in the stochastic. Back in mid-January 2005, in an article for Traders.com Advantage called "Shine On Silver Diamond?" (January 19, 2005), I noted how the bullishness of an otherwise directionally ambiguous diamond consolidation was revealed by a positive divergence in the 7,10 stochastic. As such, silver futures broke free from the diamond, feinted downward, and then rocketed upward from about $6.80 to more than $7.60. Would silver futures have soared higher if that positive divergence in the stochastic had not been present? Who knows? But the positive divergence was an excellent clue that the odds favored a move higher, as opposed to a move lower. |
| There was no such signal from the stochastic in the intraday chart of the $SPX shown in Figure 1. Thus, while it was as possible for the $SPX to move up and out of the diamond as it was to move down and out from the pattern, the absence of a positive stochastic divergence was another factor contributing to the notion that the path of least resistance remained downward. Finally, the measurement rule is worth noting here. The diamond pattern was approximately 10 points from top to bottom. Subtracting that amount from the value at the breakout level of about 1183-1184 (even though the breakout was initially upward) provides for a minimum downside objective of about 1173-1174. With the cash S&P 500 closing at about 1171.71, bearish traders can safely consider that minimum downside objective well met. |
Technical Writer for Technical Analysis of STOCKS & COMMODITIES magazine, Working-Money.com, and Traders.com Advantage.
| Title: | Technical Writer |
| Company: | Technical Analysis, Inc. |
| Address: | 4757 California Avenue SW |
| Seattle, WA 98116 | |
| Phone # for sales: | 206 938 0570 |
| Fax: | 206 938 1307 |
| Website: | www.Traders.com |
| E-mail address: | DPenn@traders.com |
Traders' Resource Links | |
| Charting the Stock Market: The Wyckoff Method -- Books | |
| Working-Money.com -- Online Trading Services | |
| Traders.com Advantage -- Online Trading Services | |
| Technical Analysis of Stocks & Commodities -- Publications and Newsletters | |
| Working Money, at Working-Money.com -- Publications and Newsletters | |
| Traders.com Advantage -- Publications and Newsletters | |
| Professional Traders Starter Kit -- Software | |
Click here for more information about our publications!
Comments
Date:�03/24/05Rank:�3Comment:�
Date:�03/29/05Rank:�5Comment:�

Request Information From Our Sponsors
- VectorVest, Inc.
- Executive Premier Workshop
- One-Day Options Course
- OptionsPro
- Retirement Income Workshop
- Sure-Fire Trading Systems (VectorVest, Inc.)
- Trading as a Business Workshop
- VectorVest 7 EOD
- VectorVest 7 RealTime/IntraDay
- VectorVest AutoTester
- VectorVest Educational Services
- VectorVest OnLine
- VectorVest Options Analyzer
- VectorVest ProGraphics v6.0
- VectorVest ProTrader 7
- VectorVest RealTime Derby Tool
- VectorVest Simulator
- VectorVest Variator
- VectorVest Watchdog
- StockCharts.com, Inc.
- Candle Patterns
- Candlestick Charting Explained
- Intermarket Technical Analysis
- John Murphy on Chart Analysis
- John Murphy's Chart Pattern Recognition
- John Murphy's Market Message
- MurphyExplainsMarketAnalysis-Intermarket Analysis
- MurphyExplainsMarketAnalysis-Visual Analysis
- StockCharts.com
- Technical Analysis of the Financial Markets
- The Visual Investor