HOT TOPICS LIST
- MACD
- Fibonacci
- RSI
- Gann
- ADXR
- Stochastics
- Volume
- Triangles
- Futures
- Cycles
- Volatility
- ZIGZAG
- MESA
- Retracement
- Aroon
INDICATORS LIST
LIST OF TOPICS
PRINT THIS ARTICLE
by Gary Grosschadl
This Dell daily chart depicts a large symmetrical triangle that is a neutral pattern until it breaks.
Position: Buy
Gary Grosschadl
Independent Canadian equities trader and technical analyst based in Peterborough
Ontario, Canada.
PRINT THIS ARTICLE
SYMMETRICAL TRIANGLE
Dell Reaches Critical Support
03/23/05 07:45:42 AMby Gary Grosschadl
This Dell daily chart depicts a large symmetrical triangle that is a neutral pattern until it breaks.
Position: Buy
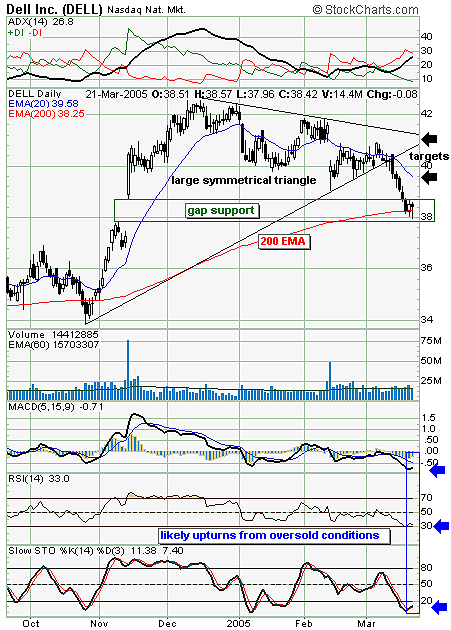
| Seven trading days ago, a large black candlestick marked the breakdown of this triangle pattern. Even without convincing volume, five bearish days followed leading to a potentially strong level of support. |
| A bounce is likely here for several reasons, and I indicate a buy here only as a short-term trading position for higher-risk traders. This may result in a bear rally, failing at overhead resistance. Support here is based on a previous large gap from last November, the correction to the 200-day exponential moving average (EMA) and the large-tailed candlestick. Stocks often bounce at their 200-period moving averages as these closely watched points become trading targets, even if short-lived. The first bullish candle that halted the downleg is considered a harami pattern, as the candle body is contained within the previous candlestick body. This is a sign of potential support offered by bulls coming in anticipating a bounce at this 200-day EMA. The next trading session with its near-doji or near-hammer shows a long lower tail "reaching" to mark a bottom. |

|
| Figure 1: DELL. Dell reaches critical support but also faces an important upside test going forward. |
| Graphic provided by: StockCharts.com. |
| |
| The three indicators below Figure 1 all hint at likely upturns from oversold conditions. These indicators need to improve via a stochastic move above 20, a relative strength index (RSI) uptick and the moving average convergence/divergence (MACD) line crossover of its smaller blue signal line. |
| Stocks that break out of symmetrical triangle patterns often come back to test the apex of the triangle before resuming the former downtrend. This is often the make-or-break point, as either the breakdown of the triangle was a false move and it now goes bullish north, or the retest fails and a stronger downward move resumes. Aggressive traders going short may be waiting to make their move at the first sign of trouble at overhead resistance. An increase in trading volume with failure at either overhead resistance levels of 20-day EMA or the apex point will exasperate the downward pull, with short-term traders taking quick profits while traders taking short positions move in. I show the 20-day EMA as another possible trading target as this level often becomes overhead resistance for stocks in trouble. |
| In summary, this chart analysis suggests a short-term buy situation followed by a potentially bigger downward move IF the apex test or 20-day EMA test fails. |
Independent Canadian equities trader and technical analyst based in Peterborough
Ontario, Canada.
| Website: | www.whatsonsale.ca/financial.html |
| E-mail address: | gwg7@sympatico.ca |
Click here for more information about our publications!
Comments
Date: 03/24/05Rank: 5Comment:

Request Information From Our Sponsors
- StockCharts.com, Inc.
- Candle Patterns
- Candlestick Charting Explained
- Intermarket Technical Analysis
- John Murphy on Chart Analysis
- John Murphy's Chart Pattern Recognition
- John Murphy's Market Message
- MurphyExplainsMarketAnalysis-Intermarket Analysis
- MurphyExplainsMarketAnalysis-Visual Analysis
- StockCharts.com
- Technical Analysis of the Financial Markets
- The Visual Investor
- VectorVest, Inc.
- Executive Premier Workshop
- One-Day Options Course
- OptionsPro
- Retirement Income Workshop
- Sure-Fire Trading Systems (VectorVest, Inc.)
- Trading as a Business Workshop
- VectorVest 7 EOD
- VectorVest 7 RealTime/IntraDay
- VectorVest AutoTester
- VectorVest Educational Services
- VectorVest OnLine
- VectorVest Options Analyzer
- VectorVest ProGraphics v6.0
- VectorVest ProTrader 7
- VectorVest RealTime Derby Tool
- VectorVest Simulator
- VectorVest Variator
- VectorVest Watchdog
