HOT TOPICS LIST
- MACD
- Fibonacci
- RSI
- Gann
- ADXR
- Stochastics
- Volume
- Triangles
- Futures
- Cycles
- Volatility
- ZIGZAG
- MESA
- Retracement
- Aroon
INDICATORS LIST
LIST OF TOPICS
PRINT THIS ARTICLE
by Kevin Hopson
The stock has met its initial price target based on January's trading range breakout. Does this mean a second price target will come into play?
Position: N/A
Kevin Hopson
Kevin has been a technical analyst for roughly 10 years now. Previously, Kevin owned his own business and acted as a registered investment advisor, specializing in energy. He was also a freelance oil analyst for Orient Trading Co., a commodity futures trading firm in Japan. Kevin is currently a freelance writer.
PRINT THIS ARTICLE
TECHNICAL ANALYSIS
Higher Prices Could Prevail For Talisman Energy
03/23/05 07:39:01 AMby Kevin Hopson
The stock has met its initial price target based on January's trading range breakout. Does this mean a second price target will come into play?
Position: N/A
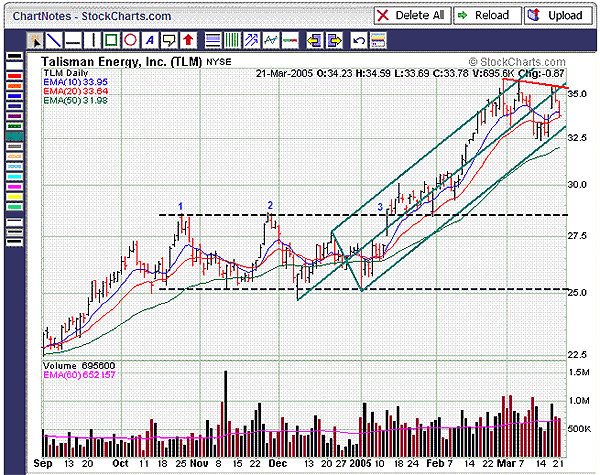
| Talisman Energy (TLM) broke out of a bullish trading range in mid-January 2005, indicating an upside target of $35.50 to $39.00. I calculated this target by taking the number of times that prices tested the top channel line in alternate sequence before breaking out (3), multiplying this number by the width of the trading range ($28.50-$25.00=$3.50) and then adding this figure ($3.50*3=$10.50) to the bottom ($25.00+$10.50=$35.50) and top ($28.50+$10.50=$39.00) channel lines. |
| As you can see in Figure 1, Talisman reached the first price target ($35.50) in late February and proceeded to pull back. However, the stock found ultimate support just below the $32.50 level, which is the site of the bottom green parallel line and the 50% retracement level from the late January to February rally. Because prices have stayed within the green pitchfork since the beginning of this year, the current uptrend remains intact. |

|
| Figure 1: Talisman. As you can see here, TLM reached the first price target ($35.50) in late February and proceeded to pull back. |
| Graphic provided by: StockCharts.com. |
| |
| There are only two things standing in the way. One is February's downtrend line, which is illustrated by the red line. The other is the green median line. Since these two trendlines have converged around the $35.50 level, Talisman will need to break resistance here for the second price target to come into play. If successful, look for a further move up to the $39.00 level in the near term. |
Kevin has been a technical analyst for roughly 10 years now. Previously, Kevin owned his own business and acted as a registered investment advisor, specializing in energy. He was also a freelance oil analyst for Orient Trading Co., a commodity futures trading firm in Japan. Kevin is currently a freelance writer.
| Glen Allen, VA | |
| E-mail address: | hopson_1@yahoo.com |
Click here for more information about our publications!
Comments
Date: 03/24/05Rank: 4Comment:

Request Information From Our Sponsors
- StockCharts.com, Inc.
- Candle Patterns
- Candlestick Charting Explained
- Intermarket Technical Analysis
- John Murphy on Chart Analysis
- John Murphy's Chart Pattern Recognition
- John Murphy's Market Message
- MurphyExplainsMarketAnalysis-Intermarket Analysis
- MurphyExplainsMarketAnalysis-Visual Analysis
- StockCharts.com
- Technical Analysis of the Financial Markets
- The Visual Investor
- VectorVest, Inc.
- Executive Premier Workshop
- One-Day Options Course
- OptionsPro
- Retirement Income Workshop
- Sure-Fire Trading Systems (VectorVest, Inc.)
- Trading as a Business Workshop
- VectorVest 7 EOD
- VectorVest 7 RealTime/IntraDay
- VectorVest AutoTester
- VectorVest Educational Services
- VectorVest OnLine
- VectorVest Options Analyzer
- VectorVest ProGraphics v6.0
- VectorVest ProTrader 7
- VectorVest RealTime Derby Tool
- VectorVest Simulator
- VectorVest Variator
- VectorVest Watchdog
