HOT TOPICS LIST
- MACD
- Fibonacci
- RSI
- Gann
- ADXR
- Stochastics
- Volume
- Triangles
- Futures
- Cycles
- Volatility
- ZIGZAG
- MESA
- Retracement
- Aroon
INDICATORS LIST
LIST OF TOPICS
PRINT THIS ARTICLE
by Gary Grosschadl
The Philadelphia Gold & Silver Index was enjoying an upleg until it ran into overhead resistance best shown on a pitchfork chart.
Position: Sell
Gary Grosschadl
Independent Canadian equities trader and technical analyst based in Peterborough
Ontario, Canada.
PRINT THIS ARTICLE
ANDREWS PITCH-FORK
Gold Bounce Halted By Pitchfork Resistance
03/23/05 07:34:22 AMby Gary Grosschadl
The Philadelphia Gold & Silver Index was enjoying an upleg until it ran into overhead resistance best shown on a pitchfork chart.
Position: Sell
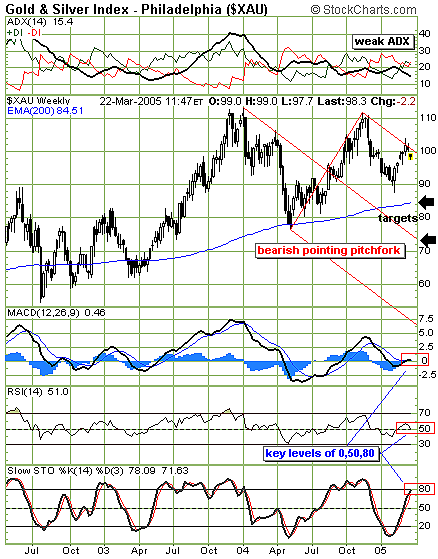
| The Philadelphia Gold & Silver Index was enjoying an upleg until it ran into overhead resistance best shown on a pitchfork chart. This charting method, which is named after Alan Andrews, is a line study consisting of three parallel trendlines based on three selected turning points. The interpretation of a pitchfork is based on normal trendline support and resistance principles. Prices tend to "walk along" the trendlines bouncing between the "tines" of the fork until there is significant trend change. A significant trend change alters the nature of the fork from downward pointing (bearish) to upward pointing (bullish) or vice versa. |
| After bouncing off the 90 level, short of the median line, the XAU enjoyed a five week bounce, which apparently ended at the upper median line. This may set up a future test of the median (center pitchfork). Many traders will no doubt also note the location of the oft-watched 200-period exponential moving average (EMA) (similar to the simple moving average, but weighted differently). This is often a trading target as it is considered an important moving trendline. Currently at 84.51, this may pause or reverse the downleg. If this support level does not hold, then the median line (currently near 70) becomes a valid target. |

|
| Figure 1: $XAU. The Philadelphia Gold & Silver Index has a bearish character since failing to move past the high-water mark of 112 in November 2004. |
| Graphic provided by: StockCharts.com. |
| |
| Several other indicators are worthy of comment. The average directional movement index (ADX) at the top of Figure 1 shows how a weak trend (below 20 or so) meant the previous downtrend would likely fall short of its mark (the center median line). As this trend is still weak, a likely outcome could be a meandering walk along the pitchfork line until a stronger move is made in either direction. The lower indicators all show potential stalls at or near key levels being the zero line for the moving average convergence/divergence (MACD), the 50 level for the relative strength index (RSI) and the 80 level for the stochastic oscillator. |
| The overall trend on this weekly pitchfork chart is decidedly bearish, although bounces at key levels may allow for short-term trading targets in both directions. A surprise close above the upper median line would negate the bearish pitchfork but until that happens, the bigger trend is down. |
Independent Canadian equities trader and technical analyst based in Peterborough
Ontario, Canada.
| Website: | www.whatsonsale.ca/financial.html |
| E-mail address: | gwg7@sympatico.ca |
Click here for more information about our publications!
Comments
Date: 03/24/05Rank: 5Comment:

|

Request Information From Our Sponsors
- VectorVest, Inc.
- Executive Premier Workshop
- One-Day Options Course
- OptionsPro
- Retirement Income Workshop
- Sure-Fire Trading Systems (VectorVest, Inc.)
- Trading as a Business Workshop
- VectorVest 7 EOD
- VectorVest 7 RealTime/IntraDay
- VectorVest AutoTester
- VectorVest Educational Services
- VectorVest OnLine
- VectorVest Options Analyzer
- VectorVest ProGraphics v6.0
- VectorVest ProTrader 7
- VectorVest RealTime Derby Tool
- VectorVest Simulator
- VectorVest Variator
- VectorVest Watchdog
- StockCharts.com, Inc.
- Candle Patterns
- Candlestick Charting Explained
- Intermarket Technical Analysis
- John Murphy on Chart Analysis
- John Murphy's Chart Pattern Recognition
- John Murphy's Market Message
- MurphyExplainsMarketAnalysis-Intermarket Analysis
- MurphyExplainsMarketAnalysis-Visual Analysis
- StockCharts.com
- Technical Analysis of the Financial Markets
- The Visual Investor
